CHEM 4214 Lecture Notes - Lecture 18: Phase Diagram, Chemical Potential, Spinodal Decomposition

Document Summary
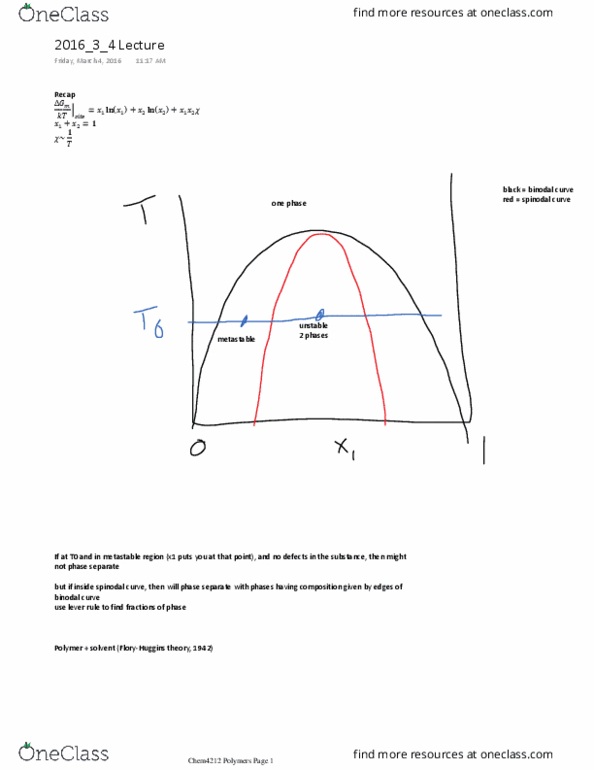
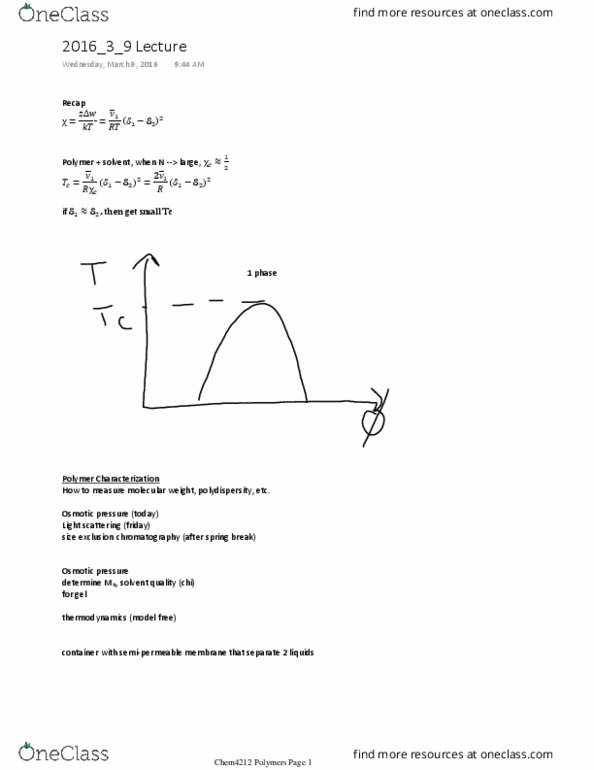
9:26 am e. g. c7h16 + c7f16 want to mix these 2 different solvents different ratios of solvents. 2 phases (phase separate) rich in solvent 1 rich in solvent 2 if given this point at some t and xf phase separate into two phasesone rich in one solvent, other rich in other fraction of 2nd solvent. Use lever rule to find fractions of 2 phases. Lattice theory we get phase diagram from free energy eqn x1 + x2 = 1 plot the two parts. Chem4212 polymers page 1 independent of temperature now dependent on t. T is in chi term low t means high chi add the 2 curves. What does system choose? at t1, will choose the lowest point on curve, same with t2. At t3, btwn 2 locations (the 2 valleys) At t4, also 2 points (phase separation) this corresponds to the valleys in above graph binodal curve. At eqbm, t" = t"" and p" = p""