ENVIRSCI 214 Lecture Notes - Lecture 11: Generation Time, Net Reproduction Rate, Life Table

27 Feb 2017
School
Department
Course
Professor
Document Summary
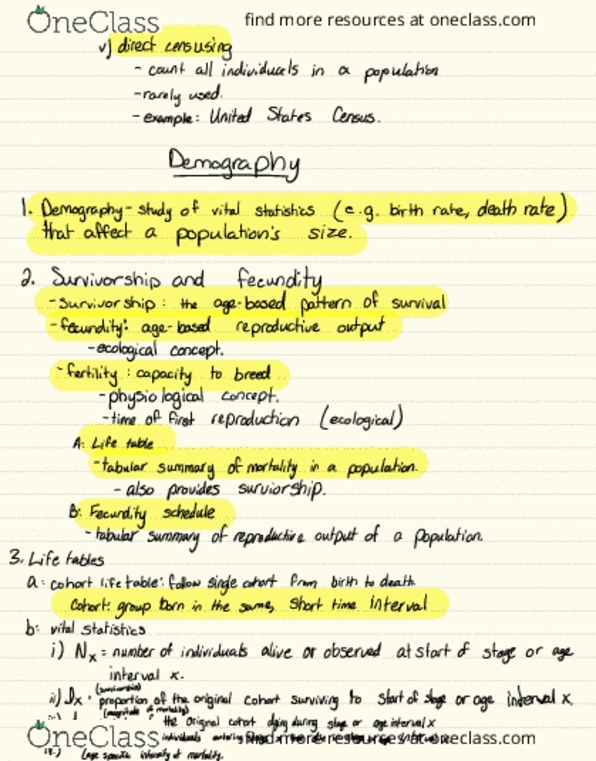
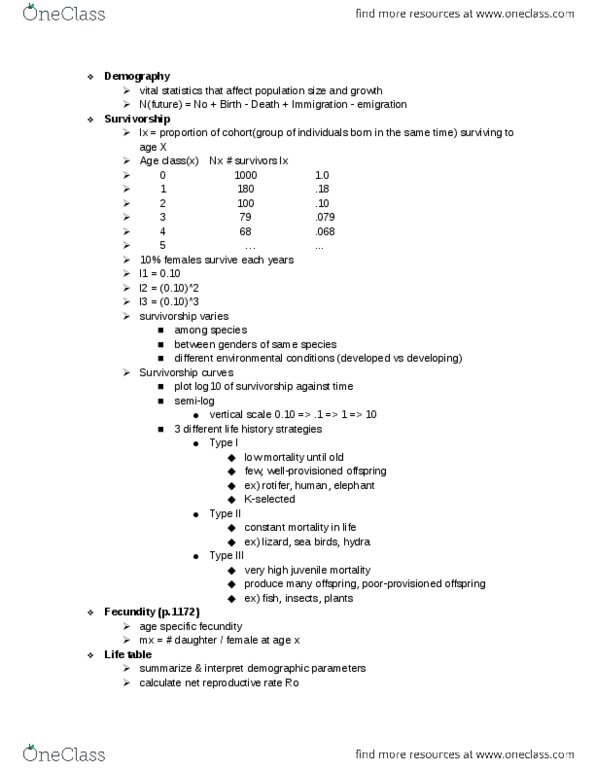
Demography -recall that a population that provides mathematical description of factors that influence growth or decline. Ix = survivorship (proportion of cohort that survives from birth to x) Beldi(cid:374)g"s g(cid:396)ou(cid:374)d s(cid:395)ui(cid:396)(cid:396)el li(cid:448)es o(cid:374) (cid:373)ou(cid:374)tai(cid:374)s i(cid:374) the (cid:449)este(cid:396)(cid:374) u - real life table. Type 1 vs. type 2 vs. type 3 survivorship curves type 2 = the ground squirrels. Type1: low death rate, many individuals live to old age. Type 2: moderate death rate and individuals die at all ages(linear line on graph) Type 3: high death rate, many individuals die young and few live to old age. (drops right from beginning in graph like an l shaped graph- l) Rep(cid:396)ese(cid:374)ts (cid:373)ea(cid:374) offsp(cid:396)i(cid:374)g p(cid:396)oduced fo(cid:396) fe(cid:373)ales that ha(cid:448)e su(cid:396)(cid:448)i(cid:448)ed to (cid:455)ea(cid:396) (cid:862)(cid:454)(cid:863) Survivorship x fecundity = net reproductive rate (tells us whether the population will increase or decrease) Net reproductive rate (ro ) : mean number of offspring produced by an individual during its lifetime.