GEOG 371 Lecture Notes - Lecture 12: Sxs, Level Of Measurement, Covariance

5 May 2018
School
Department
Course
Professor

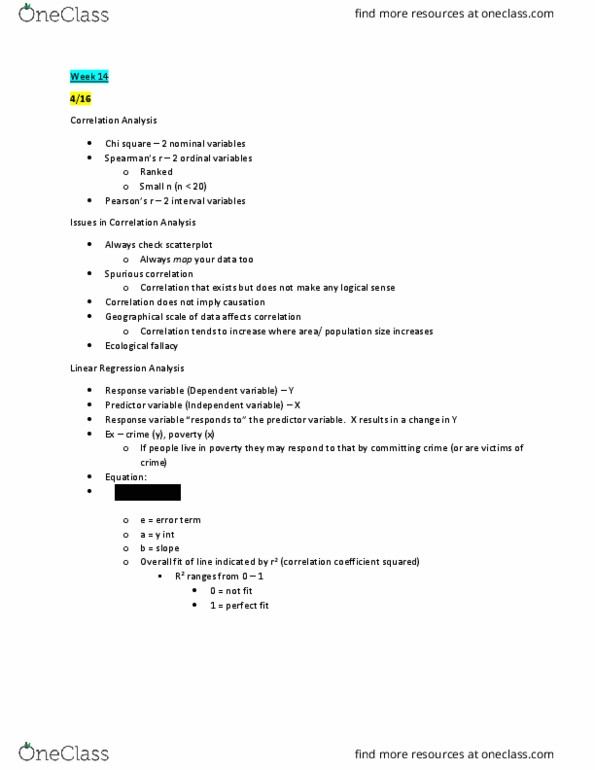
4/9 – Correlation Analysis
Correlation Analysis
• Association between two interval scale variables
o Ex – crime rate and poverty
• Enables us to quantify special association b/w 2 variables
• 1st step – display data in scatterplot
Correlation Coefficient Pearson’s r
• R =
(-)
(+)
(+)
(-)
• Covariance tells you directionality
o If = 0 → no correlation
o If > 0 → positive correlation
o If < 0 → negative correlation
• r measures strength and direction of linear association between X and Y
o Range: -1 to +1
o 1 = perfect linear positive correlation
o -1 = perfect linear negative correlation
Significance Test for r
• Is the correlation significantly different from zero?
o Non-directional → 2 tailed test
o P = population correlation coefficient
o R = sample correlation coefficient
o Ho = correlation (r) = 0
o Ha = r ≠ 0
• Is there a negative correlation?
o Specific direction → directional one-sided)
o Ho: r ≥ 0
o Ha: r < 0 (negative correlation, thing you expect to find)
• T-Statistic/ t-test:
o
o Decision based on p-value
o Rules of thumb: if absolute value of t value >2.0, then reject Ho (2-sided)
yx
xy
SS
S
yx
xy
StdDevStdDev
Covariance
*
=
=
yx
n
i
ii
SS
nYYXX
1
}/))({(
)(
)(
)(
2
1
2
2
ndf
r
nr
t
find more resources at oneclass.com
find more resources at oneclass.com