PADP 7120 Lecture Notes - Lecture 4: Statistical Parameter, Unimodality, Point Estimation

12 Feb 2019
School
Department
Course
Professor
Document Summary
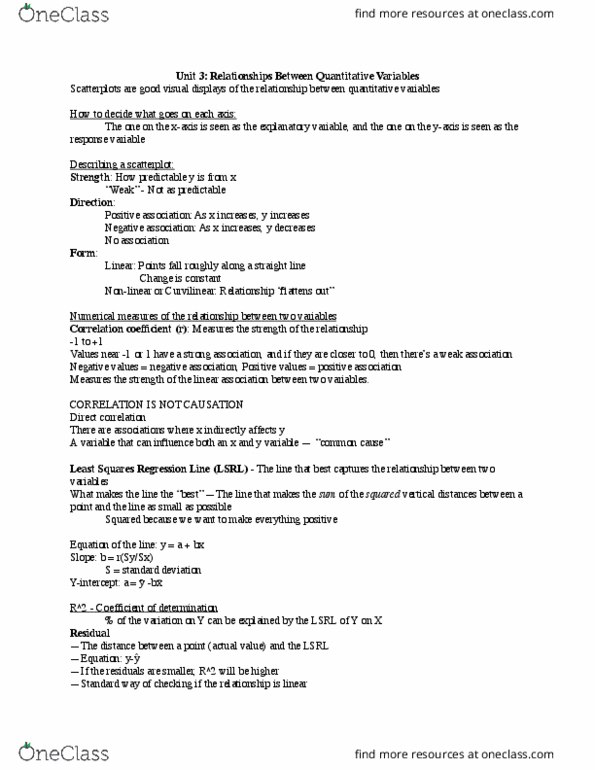
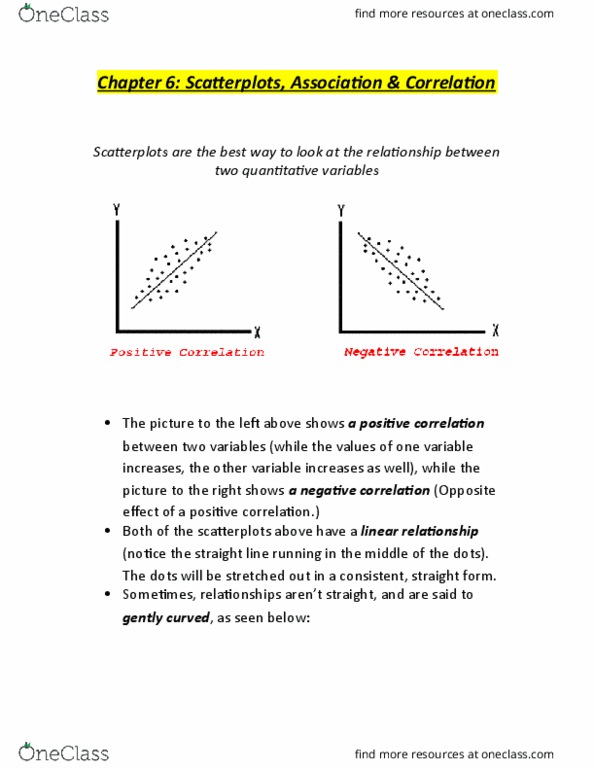
As one variable increases, the other decreases (2) positive, linear association. As one variable increases, the other increases (3) no association. Dot plots: useful for visualizing numerous observations on one numerical variable & for making observations of the distribution of the data (i. e. center, shape, & spread, darker dots = more observations, dot plots & mean. Sample mean (sample statistic) measures the center of a data set"s distribution. Serves as a point estimate of the population mean. Population mean (population parameter) often not able to calculate because a population"s data is not always available. Right skewed > more rare units on the right. Left skewed > more rare units on the left. Symmetric > highest frequency is in the center: variance. Roughly the average squared deviation from the mean: standard deviation. Square root of variance: q1, q3, & iqr illustrated by box plot. Median > 50th percentile (midpoint of data)