MATH 2250 Lecture 14: Section 4.4 - Concavity and Curve Sketching

28 Mar 2018
School
Department
Course
Professor
Document Summary
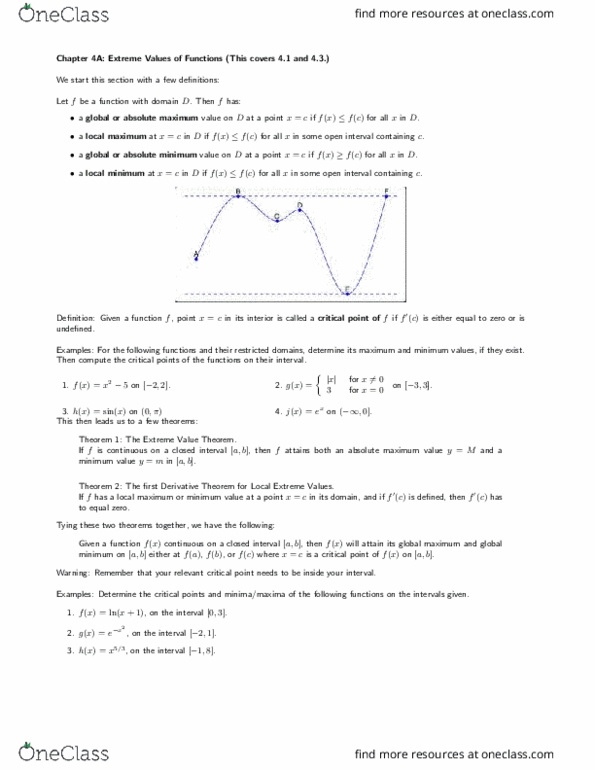
We start with a review: remember that if a function f (x) is increasing on an interval (a, b), then f (x) must be positive. And the instantaneous rate of change of f (x) at x = c is computed as f (c) and measures the rate at which the function changes at that point. If we take this concept to the second derivative, f (c) would measure the rate at which the rate of change is changing at a point. This leads us to four possibilities, as outlined in this image below: For a function f (x), an in ection point is a point on the graph of f (x) where concavity changes. From our graphic above, the graph of f (x) will be below the tangent line for all x values on the interval (0, 2). This means f (x) is concave down on this interval.