MGT 103 Lecture Notes - Lecture 11: Dexcom, Pie Chart, Market Basket

15 Mar 2018
School
Department
Course
Professor


Document Summary
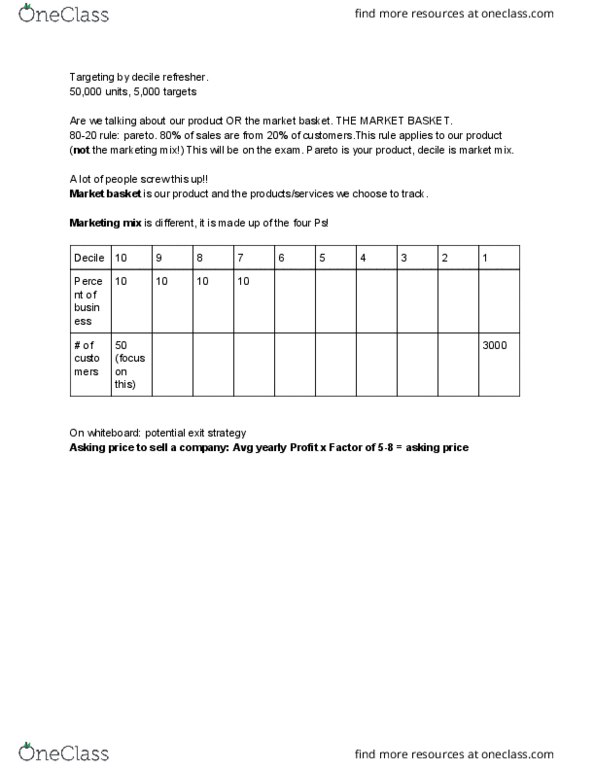
Ties to what we have covered all quarter! Pareto principle : 80/20 - 20% of the customers generate 80% of sales. Market basket : that pie chart of the number sold in dollars, looks at share, adds up to. All targets are customers, but not all customers are targets fyi. Market basket : us and the key competitors we choose to track. Number of targets for dexcom: 1000 targets (san diego) ( 5000 rx units) We take our customers and we put them into deciles, clumps of 10. Ex. out of 1000 doctors who could prescribe the product, they combined sold. Decile chart will be on exam and a big part (10-15 points worth) Middle # of customers (targets) current and potential! Bottom row should add to 1000, because that is the number of doctors who can prescribe. 5 mds write 500 prescriptions for the quarter. They are under the 10 row, and they are.