STAT 1000Q Lecture Notes - Lecture 2: Percentile, Interquartile Range, Data Set

29 Mar 2017
School
Department
Course
Professor


73
STAT 1000Q Full Course Notes
Verified Note
73 documents
Document Summary
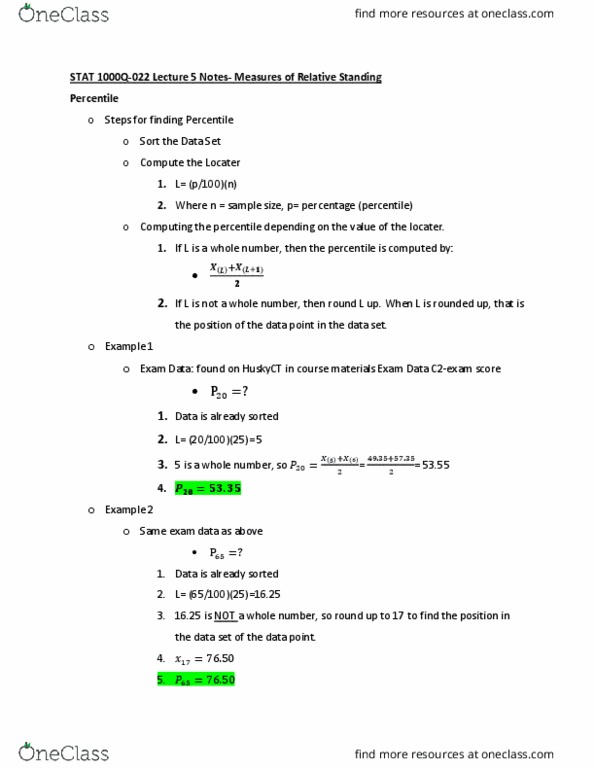
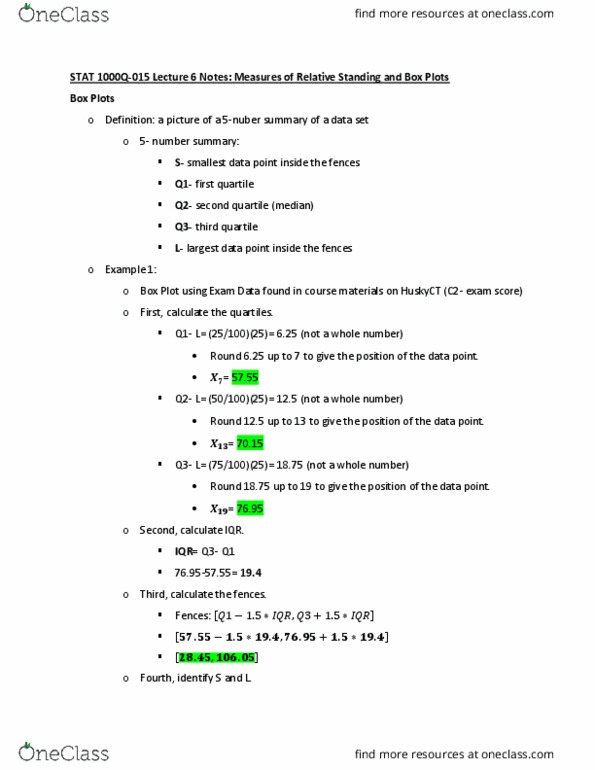
Measures of relative standing, box plots, and linear regression. The pth percentile of a set of measurements is a value for which: At least p% of the measurements are less or equal than that value. At least (100-p)% of all the measurements are greater or equal than that value. Finding the percentile: sort the original data (x1, x2, ,xn, compute the value of the locator, l = p = n p = % n = sample size. Compute the percentile (depends on the value of the location) If l is a whole number, then the percentile is given by xl + xl+1 a. If l is not a whole number, then we round l up [l], and the percentile is x([l]) Step 2: compute the locator = l = p (n) = 20 (8) = 8 = 1. 6 = (1. 6 is not a whole number) Step 3: compute p20 = l = 1. 6, round up to [l] = [2]