STATS 101B Lecture Notes - Lecture 12: Venn Diagram, Sample Space

Document Summary
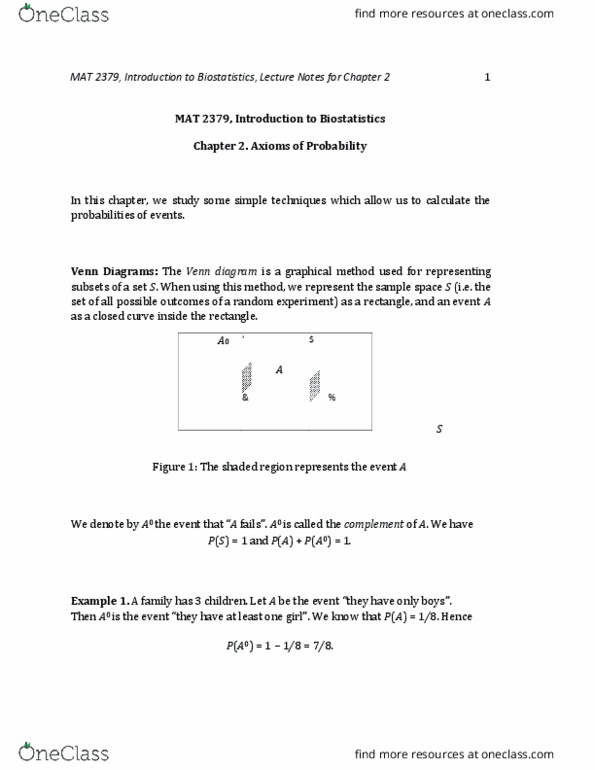
Some of the ideas in the previous section are better understood visually, with the aid of a venn diagram. A venn diagram is used to represent sets of outcomes. Usually we use a rectangle to represent the sample space: An event a is a set of outcomes in that sample space: We might have more than one event for example, there might be another event b: A and b are the two circles; the event a b is their intersection, which is the lens-shaped area in the middle. A b is the union of the two shapes; it is the set of all points that those two shapes cover. Think of p(a) as being the area of a relative to the sample space. Collectively exhaustive means that a and b together cover the whole sample space: Sample space (in this picture, a is red, b is blue, and their intersection is the purple region. )