STATS 10 Lecture Notes - Lecture 9: Central Limit Theorem, Statistical Parameter, Statistical Hypothesis Testing


Chapter 8: Hypothesis Testing for Population Proportions
Review:
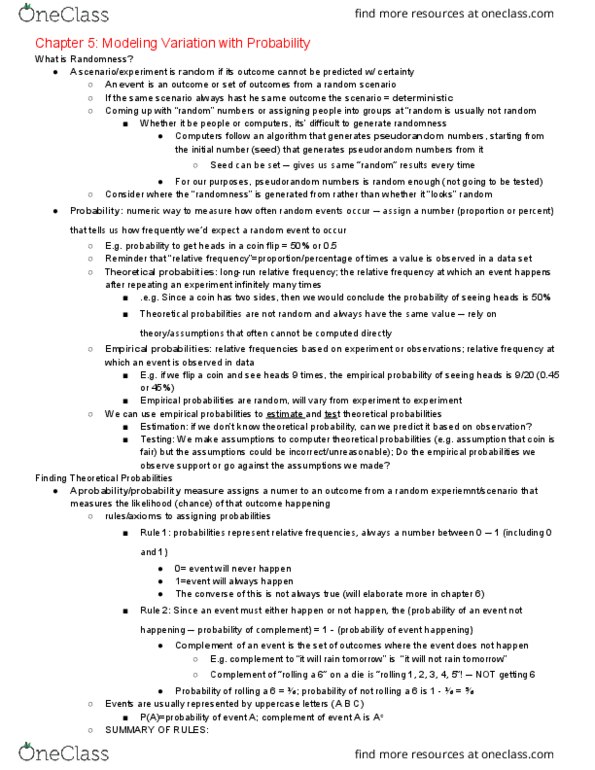
● Theoretical probabilities: long-run relative frequencies; relative frequency at which an event happens after
repeating an experiment infinitely many times
○ Not random, always have the same value; rely on theory and assumptions and cannot be computed
directly
● Empirical probabilities: relative frequences based on an experiment or observations; relative frequency at which
an event is observed in data
○ Random and will change from experiment to experiment
● We can use empirical probabilities to estimate and test theoretical probabilitiies
○ Estimation: can we make a good guess/prediction as to what the theoretical probability is based on what
we observe?
○ Test: Do the empirical probabilities we observe support or contradict the assmptions we made to
computer theoretical probabilities?
● Population: group of objects/people we wish to study
● Parameter: numerical value that characterizes some aspect of the population
● Sample: collection of objects or people taken from the population of interest
● Statistic: a numerical characteristic of a sample of data
○ STATISTICAL INFERENCE: the art and science of drawing conclusions about a population based on
observing a subset of the population → uncertainty in our conclusions
● Central Limit Theorem for Sample Proportions
○ Let p denote the true population proportion of people or objects with some characteristic. If:
■ 1. We take a random sample of the population
■ 2. The sample is large
■ 3. The population size is much larger than the sample size
● → THEN the sampling distribution of the sample proportion p-hat is approximately
Normal, with mean p (the population proportion) and a standard deviation given by the
standard error SE = sqrt (p(1-p) / n) → N (P, sqrt(p(1-p)/n) model
● If p is unknwon, the observed value p-hat can be used to calculate the estimated
standard error (SEest = sqrt (p-hat(1-p-hat) / n)
Hypothesis Testing
● Statistical hypothesis: an assumption or cliam about a population parameter
● Hypothesis testing: procedure that enables us to use and analyze data to decide between two statistical
hypotheses
○ A type of statistical inference, since we’re using data on a sample to make conclusiosn about a pop.
parameter
○ FOUR MAIN STEPS
1. Hypothesize: state the hypothesis/claim you want to test against a neutral, skeptical claim
2. Prepare: determine how you will use data to make your decision and make sure you have enough
data to minimize the chance of a wrong conclusion
3. Compute to compare: collect data and compare them to your expectations
4. Interpret: Make conclusiosn based on teh results
● Null hypothesis (H0) is the neutral, status quo, skeptical statement about a population parameter; often
represents “no change, no effect, or no difference”
○ Will always have a = sign
● Alternative hypothesis (Ha) is the research hypotesis; statement about the value of a parameter we intend to
demonstrate is true
○ Hypotheses are ALWAYS about population parameters, and NEVER statements about sample statistics
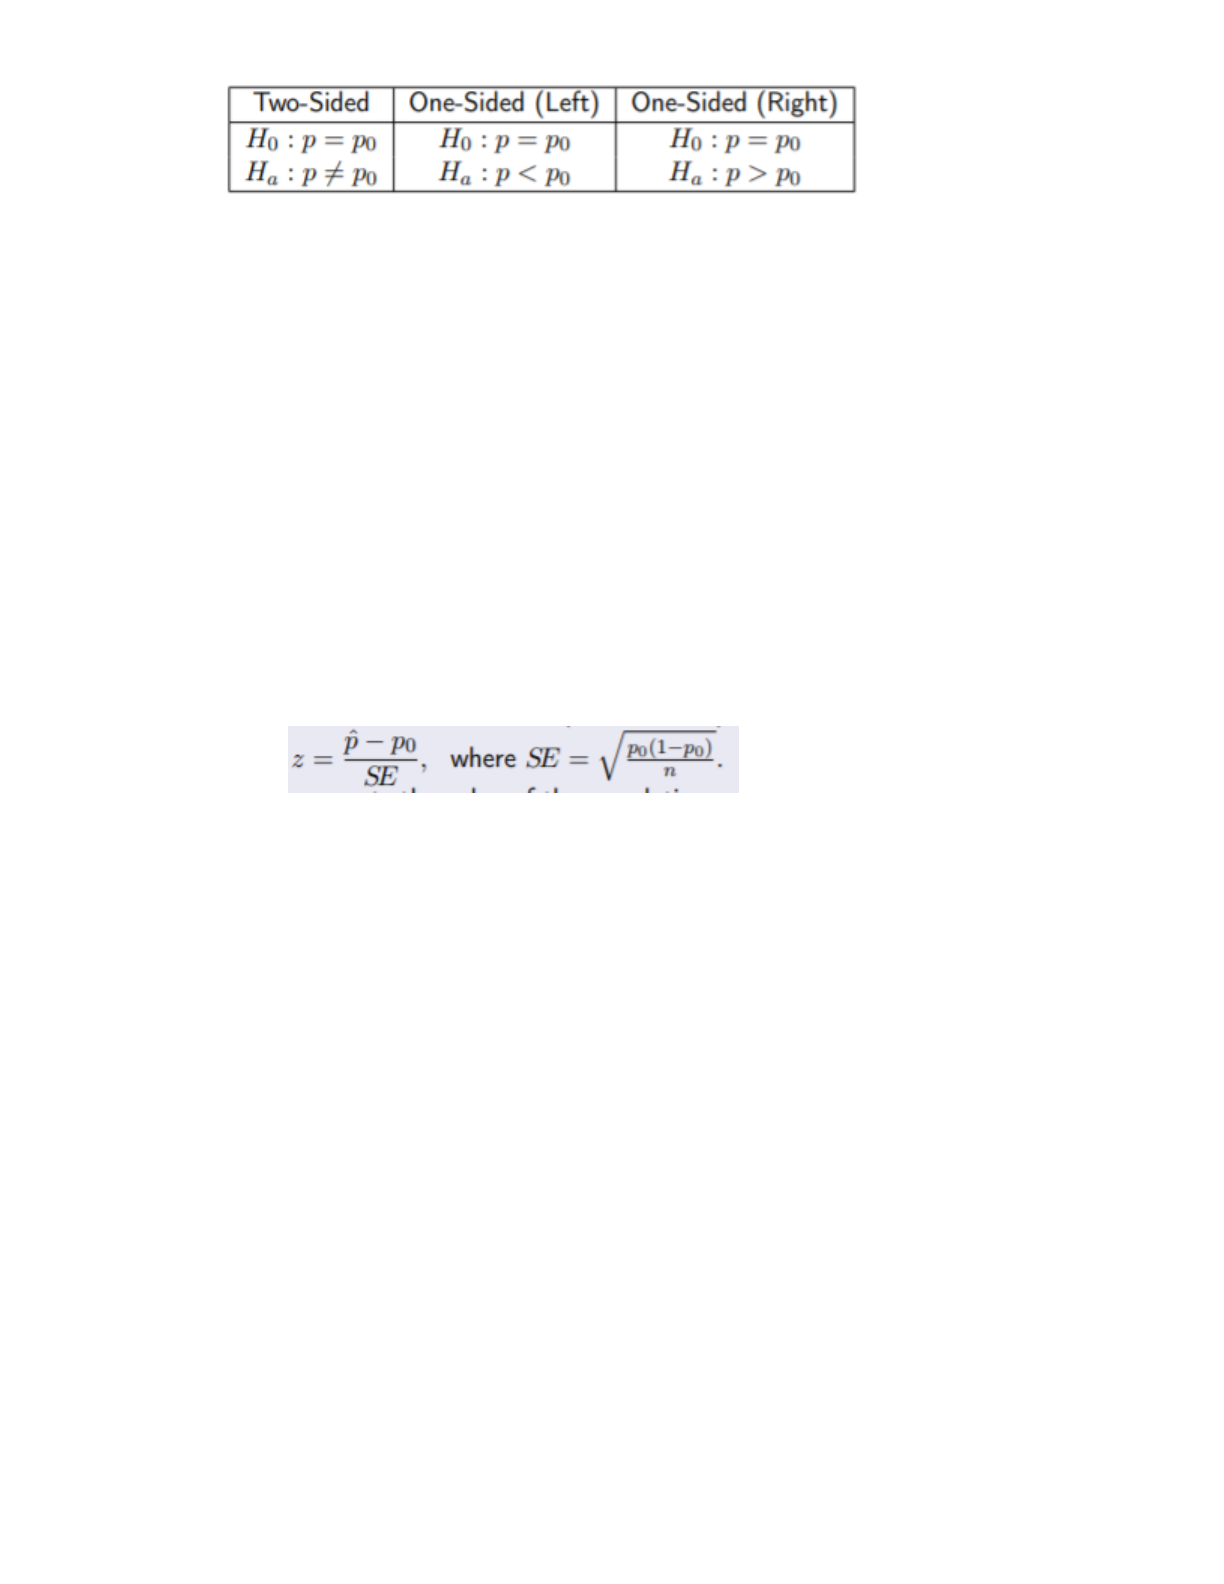
○ Alternative hypothesis w/ a “<” or “>” sign = one-sided hypothesis
○ Alternative hypothesis has a “≠ sign = two-sided hyothesis
find more resources at oneclass.com
find more resources at oneclass.com
○
■ P0 represents the value of the population proportion that the null hypothesis claims to be true
● Analgous to innocent until proven guilty → null hypothesis si assumed to be true throughout the hypothesis
testing procedure
● Significance level of a hypothesis test = probability of mistakenly rejecting a (actually true) null hypothesis →
type I error
○ Denoted by greek letter α (alpha)
■ α=1 → regardless of data, we always reject the null hypothesis; significance level is 100%
■ α=0 → regardless of data, we never reject the null hypothesis, the significance level is 0%
■ Neither α=1 or 0 are very informative; we want a procedure with a small significance level, since
we don’t want too many mistakes
■ Significance level can depend on context; many use α=0.05, and in some contexts, α=0.10 or
0.01 is more common
● Test statistic: a value (statistic) that compares our observed outcome with the outcome the null hypothesis says
we should see
○ The one proportion z-test statistic (or z-statistic) =
■ The value p0 represents the value of the population proportion p that the null hypothesis claims to
be true
■
■ Note that he denominator in z-statistic uses the standard error assuming hte null hypothesis H0:
p=p0, and NOT the observed value p-hat
■ z= observed vaue - null mean / null standard error
■ Z-statistic measures distance from the expected value assuming the null hypothesis, in units of
standard errors
● Test statistic: + → outcome was larger than expected
● Test statistic: - → outcome was smaller than expected
● Test statistic: 0 (or close to 0) → observed value is close to what we expected if the null
hypothesis was TRUE; little to no evidence to doubt null hypothesis
● The farther the test statistic is from 0, the more we doubt the null hypothesis; large values
are evidence againdt the null hypothesis
○ P-value is the probability of observing a test statistic as extreme as the observed value, if the null
hypothesis is true→ used to measure surprise!
■ Small p-values (closer to 0) → we are surprised; if the null hypothesis is true, what we observed
rarely happens
■ Large p-values (closer to 1) → we are not surprised; if the null hypothesis is true, what we
observed happens pretty often
FOUR STEPS TO A HYPOTHESIS TEST:
● Hypothesize
○ State the hypotheses about the population parameter
● Prepare
○ State a significance level
find more resources at oneclass.com
find more resources at oneclass.com
Document Summary
Theoretical probabilities: long-run relative frequencies; relative frequency at which an event happens after repeating an experiment infinitely many times. Not random, always have the same value; rely on theory and assumptions and cannot be computed directly. Empirical probabilities: relative frequences based on an experiment or observations; relative frequency at which an event is observed in data. Random and will change from experiment to experiment. We can use empirical probabilities to estimate and test theoretical probabilitiies. Population: group of objects/people we wish to study. Parameter: numerical value that characterizes some aspect of the population. Sample: collection of objects or people taken from the population of interest. Statistic: a numerical characteristic of a sample of data. Statistical inference: the art and science of drawing conclusions about a population based on observing a subset of the population uncertainty in our conclusions. Let p denote the true population proportion of people or objects with some characteristic. We take a random sample of the population.