STATS 10 Lecture Notes - Lecture 8: Statistical Inference, Statistical Parameter, Bias Of An Estimator

Chapter 7: Survey Sampling and Inference
Survey Sampling and Bias
● survey=activity that collects or acquires statistical data; often in the form of asking a group of people a series of
questions about a reserach topic of interest
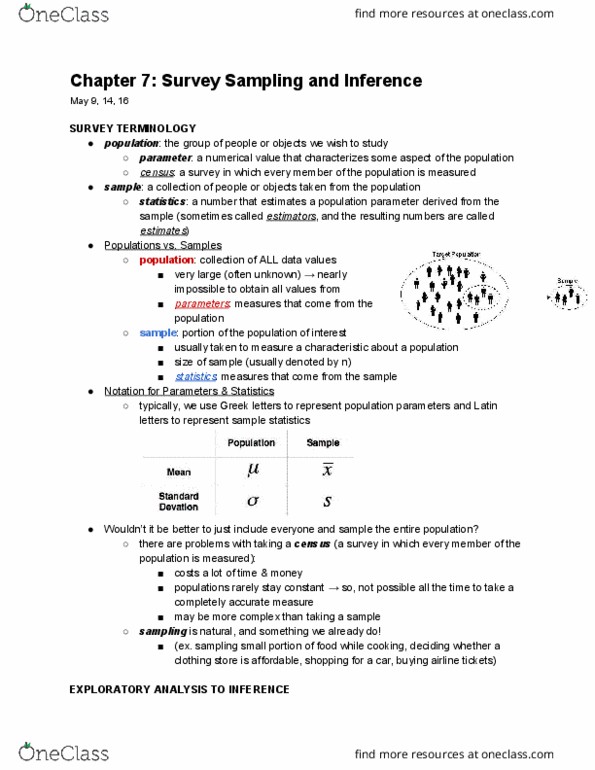
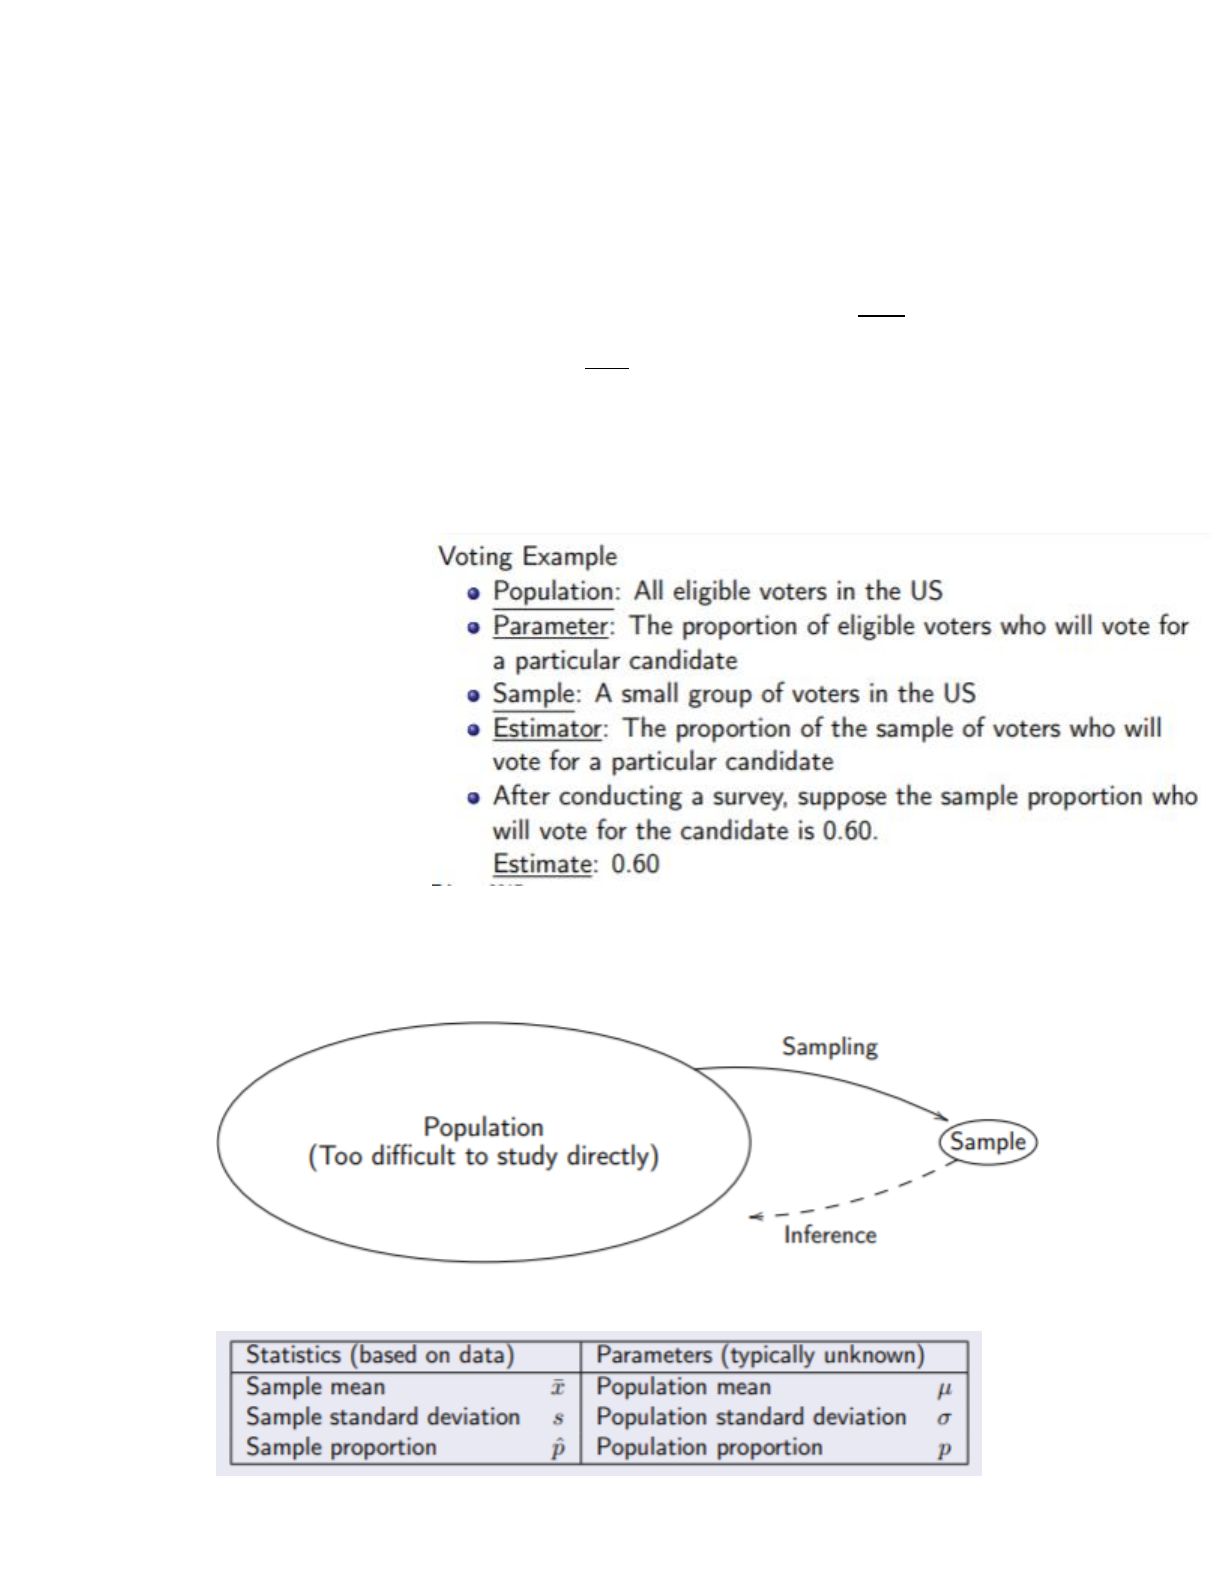
○ population=group of objects/people we wish to study (e.g. all UCLA students)
○ parameter=numerical value that characterizes some aspect of the population (e.g. mean height of all
UCLA students)
○ Goal is usually to make a tatement about a ppulation parameter
■ We can find the exact value of the parameter if the population is small by conducting a census
● census= a survey in which every member of the population is measured
■ For most populations, they’re too large/too difficult to conduct a census, so we observe a smaller
sample
● sample=collection of objects or people taken from the population of interest
● statistic=numerical characteristic of a sample of data
○ Aka estimator, since statistic is used to estimate the value of a characteristic of
a population → the number an estimator gives from a specific sample=estimate
○
● Statistical inference= the art and science of drawing conclusions about a population based on observing a
subset of the population
○ Using limited data to draw conclusions on an unobserved population → UNCERTAINTY
○ Large part of statistical inference is measuring that uncertainty
○ Statistics are quantities based on data from an OBSERVED sample, while parameters are typically
UNKNWON quantities based on the UNOBSERVED population
○
● A survey is biased if it has a tendency to produce an untrue value
find more resources at oneclass.com
find more resources at oneclass.com
○ Sampling bias: results from taking a sample that is not representative of the population
■ E.g. systematically excluding/including with or without a certain characteristic
■ Response (nonresponse) bias: over/undersampling based on who is likely to respond to the
survey
● If a large prportion of ppl who are asked to participate in a survey don’t respond or refuse
to answer questions
● If respondents themselves choose to participate voluntariliy
● Internet polls tend to be answered by people who have a strong feeling about the result
■ Simple random sampling: one way to give a representative sample (not guaranteed)
● Start w/ sampling frame, a list of everyone (or everything) in the population
● w/ sampling frame, select a person (thing) at random one by one without replacement
(no person/object can be repeated)
○ Every person/thing in the pop has an equal chance of beign selected
○ Every possible sample has an equal chance of being selected
○ Random chance → some samples may not be representative of the pop
○ Measurement bias: results from asking questions/recording data in a way that does not produce a true
answer; measurements tend to record larger or smaller values than the true value
■ E.g. asking questions survey respondents will tend anwer not completely honestly (e.g. income or
weight)
■ Using incorrectly calibrated measrurement tools → systematically skewed measurements (not
resetting tare weight on scale, inconsistencies with measuring heights, etc)
■ Asking questions in a confusing way
○ Estimator bias: results from using statistics that tend to systematically over/underestimate the parameter
Measuring the quality of a survey
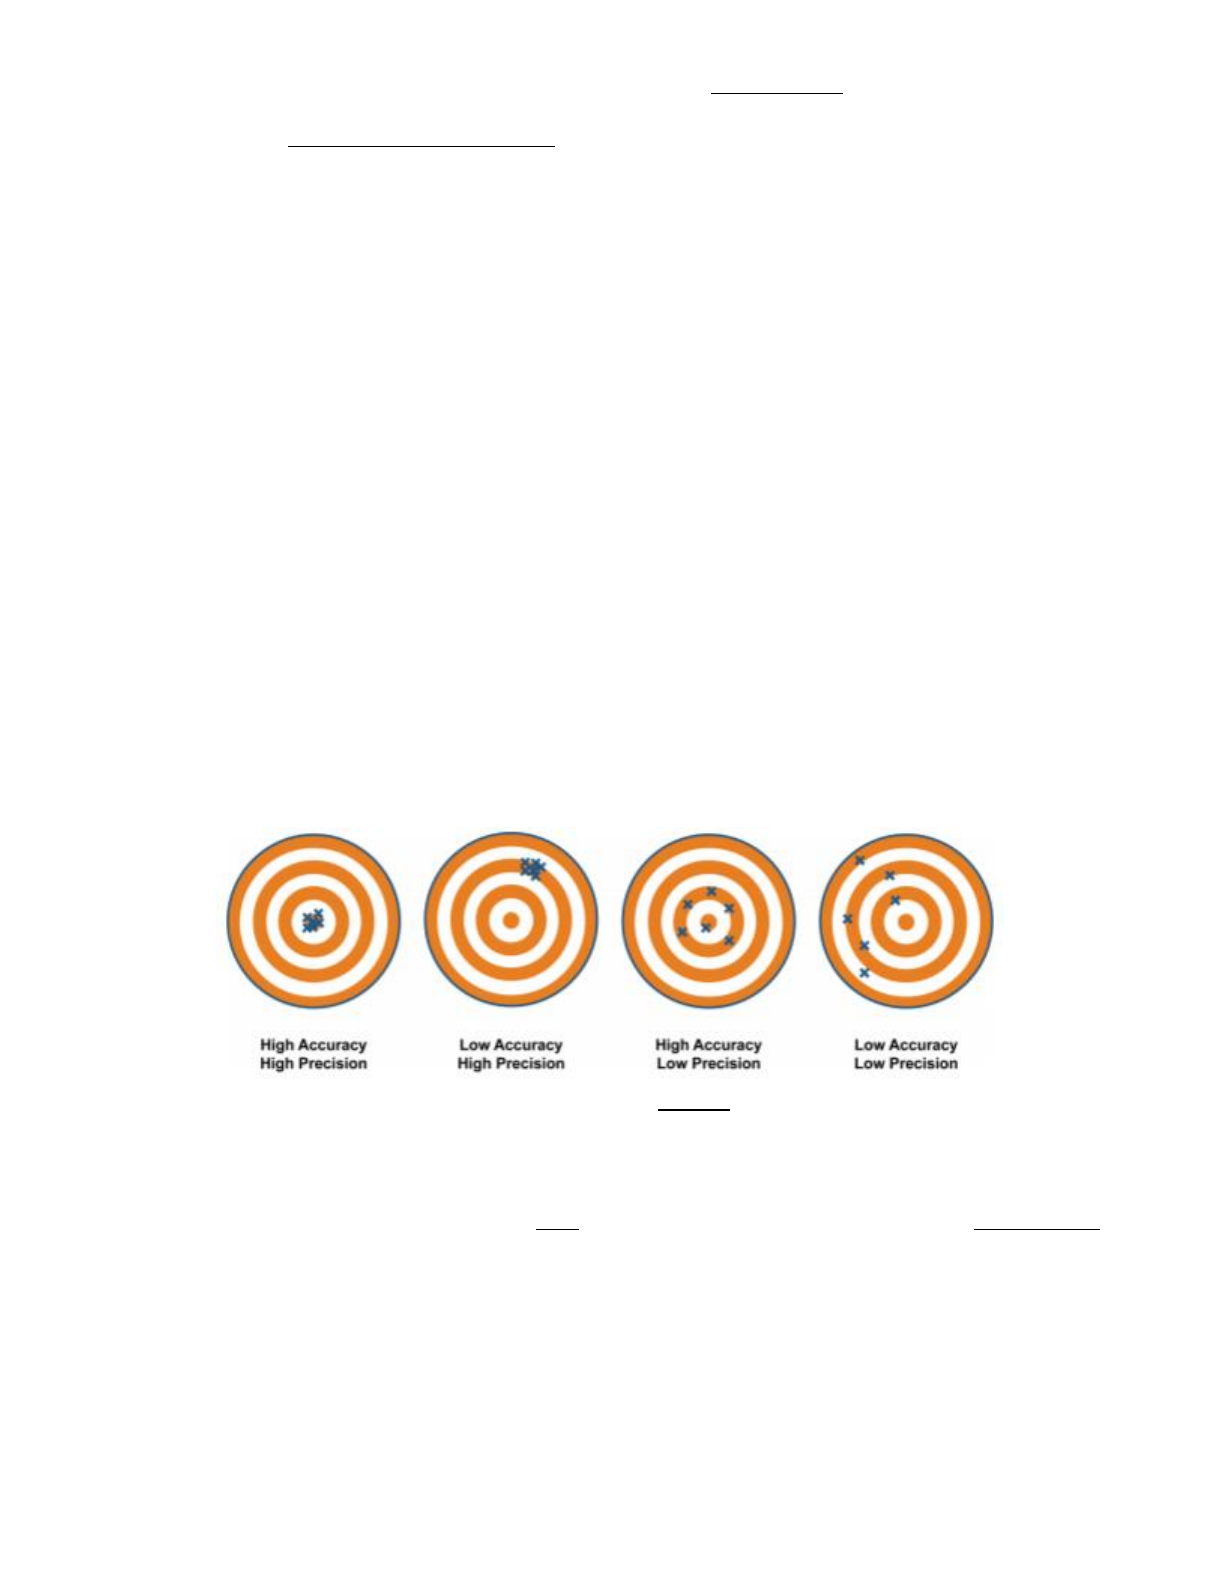
● Accuracy: does the estimation method tend, on averge, to produce estimates that are near the true parameter?
● Precision: does the estimation method tend to give similar estimates every time, or do the esstimates tend to be
spread out (i.e., have a lot of variation)?
○
● A sampling distribution is the probability distribution of a statistic
○ Surveys themselves generate different results each time, they are random experiments! Statistics based
on a sample are outcomes from a random experiment
■ → statistic (i.e. a numerical characteristic of a sample of data) has a probability distribution!
● Accuracy of an estimator is measured by its bias; precision of an estimator is measured by its standard error
○ Bias of an estimator = difference between mean value of the estimator (center of sampling distribution)
and the population parameter (rememer, estimator = statistic)
■ An estimator is unbiased if the mean value of the estimator is the population parameter (the bias
equals zero)
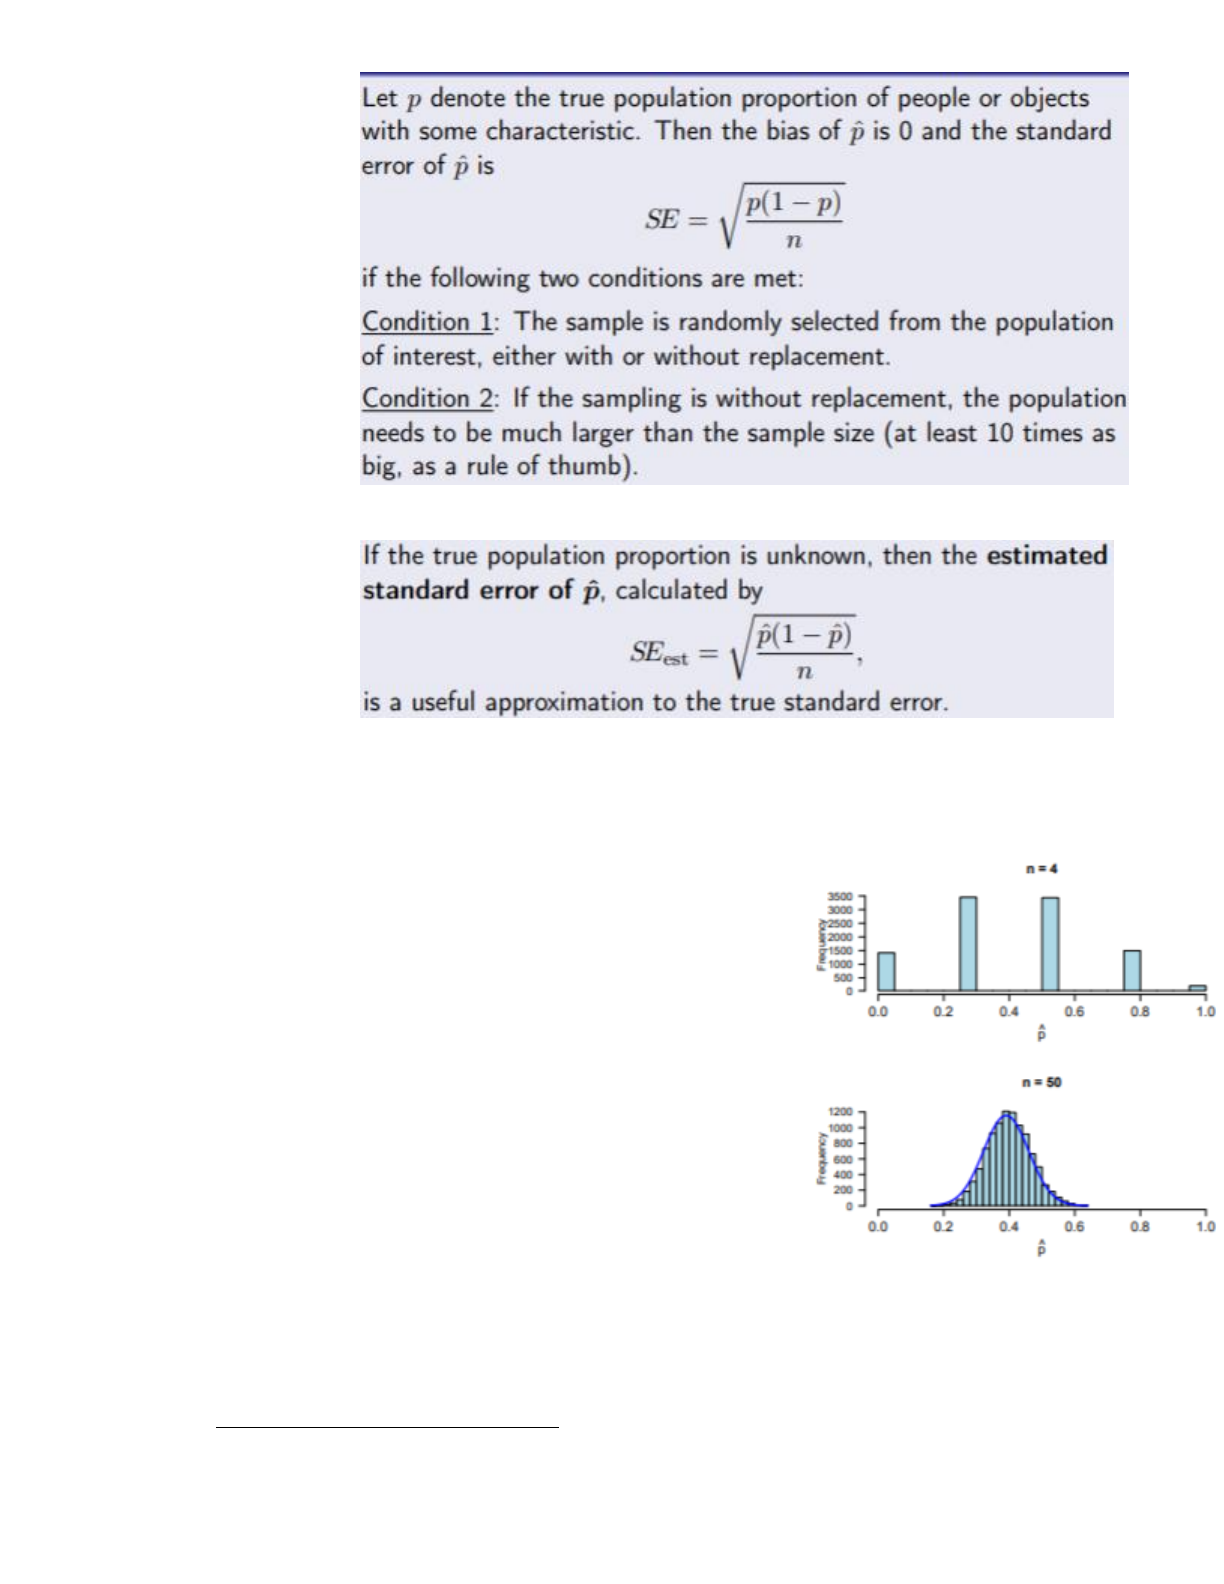
○ The standard error (SE) of an estimator (statistic) is the standard deviation of the sampling distribution
■ In general, decreases (i.e. precision increases) as the sample size gets larger!
■ We have a formula that allows us to compute the SE of p-hat for any given sample size n without
running any simulations
● GIVEN THAT P IS UNBIASED (bias=0)
find more resources at oneclass.com
find more resources at oneclass.com
●
● But true population proportion p is not usually known, so we can’t calculate the standard
error of p-hat exactly. We can estimate it by using the sample proportion
●
● If we have accurate and reasonably precise estimator, the estimates we get are likely not far off from the
population parameter!
Central LImit Theorem (CLT): gives us a very good approximation of the sampling distribution of p-hat, without using any
simulations!
● The central limit theorem for sample properties
● Let p denote the true population proportion of people/objects with some
characteristics. If:
1. We take a random sample of the population
2. The sample size is large, and
3. The population size is much larger than the sample size,
→ then the sampling distribution of the sample proportion p-hat is
approximately Normal, with mean p (the population proportion)
and standard deviation given by teh standard error SE = sqrt(p(1-
p)/n).
→ if the 3 conditions are satisfied, the sampling distribution of p-
hat approximately follows a N(p, (p(1-p)/n) ) model.
→ If p is unknown (pretty usual), the observed value of p-
hat can be used to calculate the estimated standard error
SEest
● Remember, the CLT applies with LARGE sample sizes!
● CONDITIONS for the Central Limit Theorem (for Sample Proportions)
○ Condition 1: Random and Independent → the sample is randomly selected form a pop of interest, either
with/without replacement, and observations are independent of each other
find more resources at oneclass.com
find more resources at oneclass.com
Document Summary
Survey=activity that collects or acquires statistical data; often in the form of asking a group of people a series of questions about a reserach topic of interest. Population=group of objects/people we wish to study (e. g. all ucla students) Parameter=numerical value that characterizes some aspect of the population (e. g. mean height of all. Goal is usually to make a tatement about a ppulation parameter. We can find the exact value of the parameter if the population is small by conducting a census. Census= a survey in which every member of the population is measured. For most populations, they"re too large/too difficult to conduct a census, so we observe a smaller sample. Sample=collection of objects or people taken from the population of interest. Statistic=numerical characteristic of a sample of data. Aka estimator, since statistic is used to estimate the value of a characteristic of a population the number an estimator gives from a specific sample=estimate.