ECON 1 Lecture Notes - Lecture 9: Laissez-Faire, Economic Surplus, Demand Curve


5/3/18
Chapter 7: Consumers, Producers, and the Efficiency of Markets
- Allocation of resources refers to:
o How much of each good is produced
o Which producers produce it
o Which consumers consume it
- Welfare economics: studies how the allocation of resources affects economic well-being
- Willingness to pay: the maximum amount a buyer is willing to pay for that good
o Measures how much the buyer values the good
o Ex: If the price of an iPod is $200, the only buyers who will buy the iPod are those who have a
higher WTP than the market price of the iPod ($200)
▪ QD is the amount of those willing to buy the product
o You can create a demand curve by finding out the QD for each price (P) and then graphing it
▪ The less buyers there are, the more the D curve will look like a staircase
▪ The more buyers there are, the smaller the steps are → make it a smooth curve
▪ At any Q, the height of the demand curve is the WTP of the marginal buyers
• Marginal buyer: buyer who would leave the market if P were any higher
- Consumer surplus: the amount a buyer is willing to minus the amount the buyer actually pays
o CS = WTP – P
o Oly get to ejoy osuer surplus if you’re illig to pay aoe the arket prie alue
o In the demand curve, the total CS equals the area under the demand curve above the price,
from 0 to Q
o Higher price reduces CS:
▪ Fall in CS due to buyers leaving the market
▪ Fall in CS due to remaining buyers paying higher P
- Cost: the value of everything a seller must give up to produce a good (opportunity cost)
o Includes cost of all resources used to produe a good, iludig the alue of the seller’s tie
o A seller will produce and sell the good/service only if the price exceeds his/her cost
o Cost is a measure of willingness to sell
o At each Q, the height of the S cruve is the cost of the marginal seller
▪ Marginal seller: the seller who would leave the market if the price were any lower
- Producer surplus: the aout a seller is paid for a good ius the seller’s ost
o PS = P – cost
o Total PS equals the area above the supply curve under the price, from 0 to Q
o Lower price reduces PS:
▪ Fall in PS due to sellers leaving market
▪ Fall in PS due to remaining sellers getting lower P
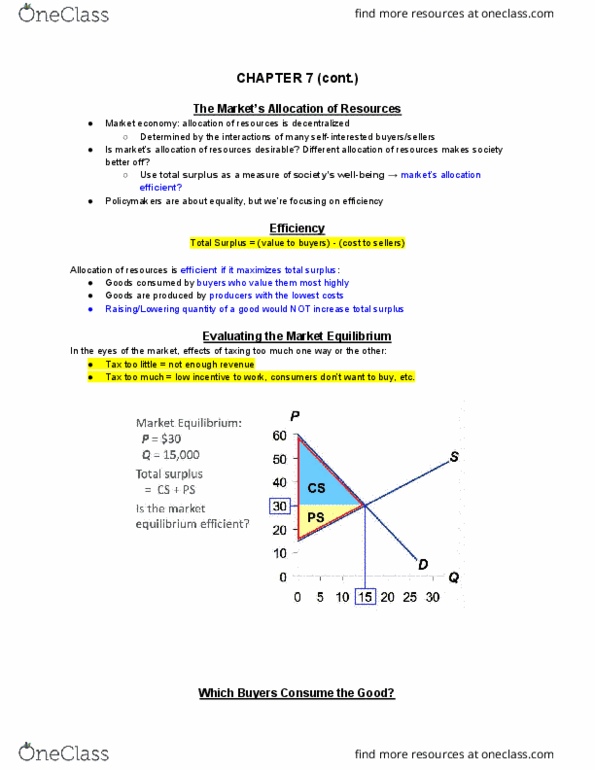
- Total surplus = CS + PS
o = total gains from trade in a market
o = (value to buyers) – (cost to sellers)
- Efficiency
o Total surplus = (value to buyers) – (cost to sellers)
o An allocation of resources is efficient if it maximizes total surplus, meaning:
▪ The goods are consumed by the buyers who value them most highly
▪ The goods are produced by the producers with the lowest costs
▪ Raising/lowering the quantity of a good would not increase total surplus
- Evaluating the market equilibrium
o The buyers who value the good most highly are the ones who consume it
o The sellers with the lowest cost produce the good
find more resources at oneclass.com
find more resources at oneclass.com
Document Summary
Chapter 7: consumers, producers, and the efficiency of markets. Allocation of resources refers to: how much of each good is produced, which producers produce it, which consumers consume it. Welfare economics: studies how the allocation of resources affects economic well-being. Consumer surplus: the amount a buyer is willing to minus the amount the buyer actually pays: cs = wtp p, o(cid:374)ly get to e(cid:374)joy (cid:272)o(cid:374)su(cid:373)er surplus if you"re (cid:449)illi(cid:374)g to pay a(cid:271)o(cid:448)e the (cid:373)arket pri(cid:272)e (cid:448)alue. Cost: the value of everything a seller must give up to produce a good (opportunity cost) Total surplus = cs + ps: = total gains from trade in a market, = (value to buyers) (cost to sellers) Evaluating the market equilibrium: the buyers who value the good most highly are the ones who consume it, the sellers with the lowest cost produce the good.