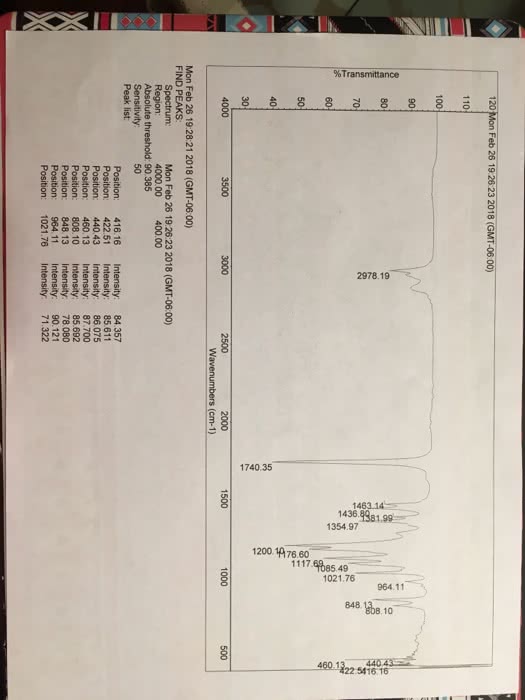
Analyze your IR spectrum to determine the structure of your product. Label all significant peaks in your IR spectrum with functional group and wavenumber.
Draw your product and explain how you determined its product.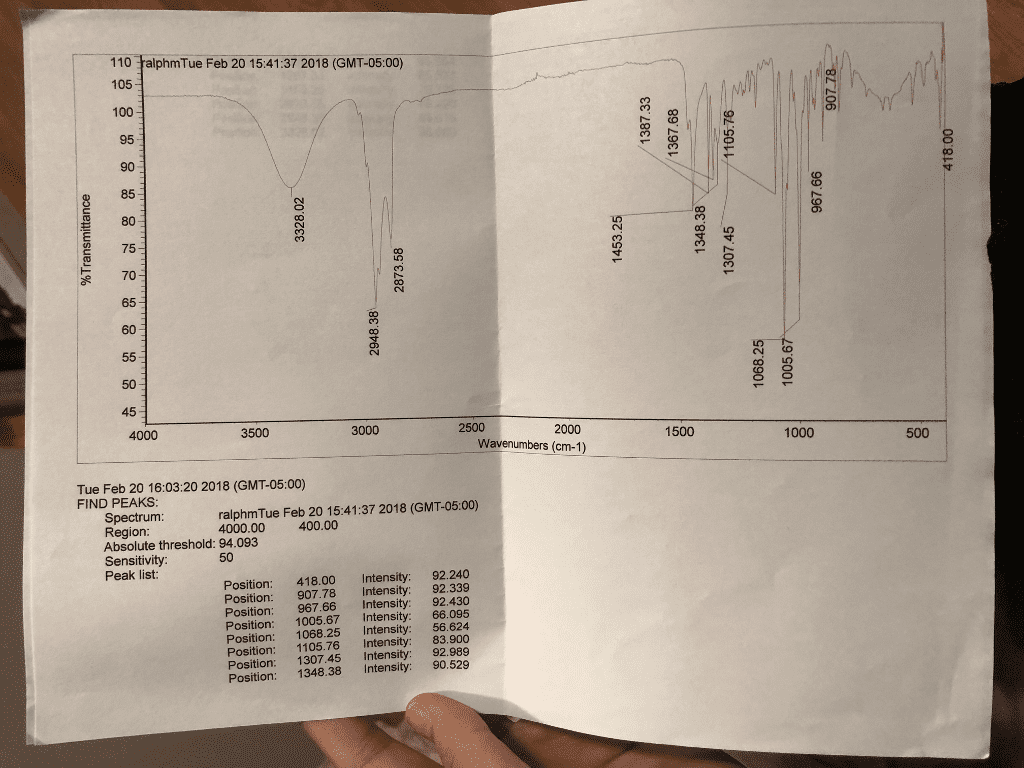
110 talphmTue Feb 20 15:41:37 2018 (GMT-05:00) 90778 1387.33 1367.68 1105.76 418.00 967.66 %Transmittance 3328.02 8 8 8 8 8 8 8 8 8 8 8 8 8 1453.25 1348.38 2873.58 1307.45 2948.38 1068.25 1005.67 4000 3500 3000 2500 2000 Wavenumbers (cm-1) 1500 1000 500 Tue Feb 20 16:03:20 2018 (GMT-05:00) FIND PEAKS: Spectrum: ralphm Tue Feb 20 15:41:37 2018 (GMT-05:00) Region: 4000.00 400.00 Absolute threshold: 94.093 Sensitivity: Peak list: 418.00 Position: Intensity: 92.240 Intensity: 907.78 Position: 92.339 92.430 Intensity: Position: 967.66 Intensity: 66.095 1005.67 Position: Position: Intensity: 56.624 1068.25 Position: 1105.76 Intensity: 83.900 Intensity: 92.989 Position: 1307.45 Intensity: 90.529 1348.38 Position: