STC 103 Lecture Notes - Lecture 2: Categorical Variable, Descriptive Statistics, Standard Deviation

24 Oct 2018
School
Department
Course
Professor
Document Summary
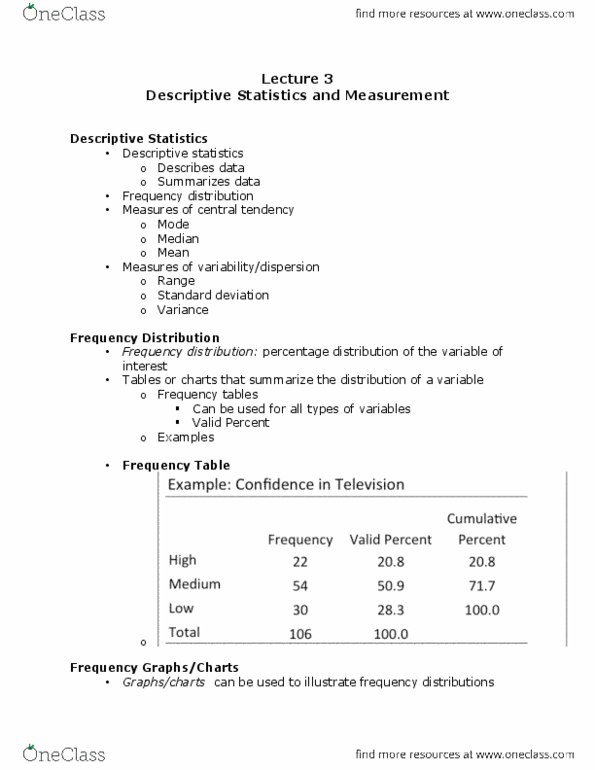
Sampling/inferential statistics: to test the predicted relationships in hypotheses. Showing the number of individuals located in each category on the scale of measurement. Frequency or number of individuals in each category. Frequency: the number of times a given score/response occurs for a particular variable (y) Percent: the percentage of all cases having this value. Valid percent: the percentage of all valid cases, cases are not missing. Y-axis = frequencies or percentages (increasing from bottom to top) for each category. Graph representing the frequency of scores in a smooth, unbroken curve. A horizontal line at each point corresponds to the interval of each score. Graphic presentation of the frequency at each score. A point is plotted above each score (frequency polygon) or measurement interval (histogram) that corresponds to the frequency with which the score was observed data. Researchers describe a distribution"s shape in words rather than drawing it. Symmetrical distribution: beachside is a mirror image of the other.