STAT 100 Lecture Notes - Lecture 8: Interquartile Range, Quartile, Box Plot

22 Feb 2017
School
Department
Course
Professor

Topic 5 Section 4.3
Measure of Spread
- Measures of spread: quartiles, standard deviation
- Five number summary and boxplot
- Choosing among summary stats
- Changing the unit of measurement
Interquartile Range (IQR)
- Difference between the first and third quartile Q3-Q1
- Resistant measure of dispersion
5.3.
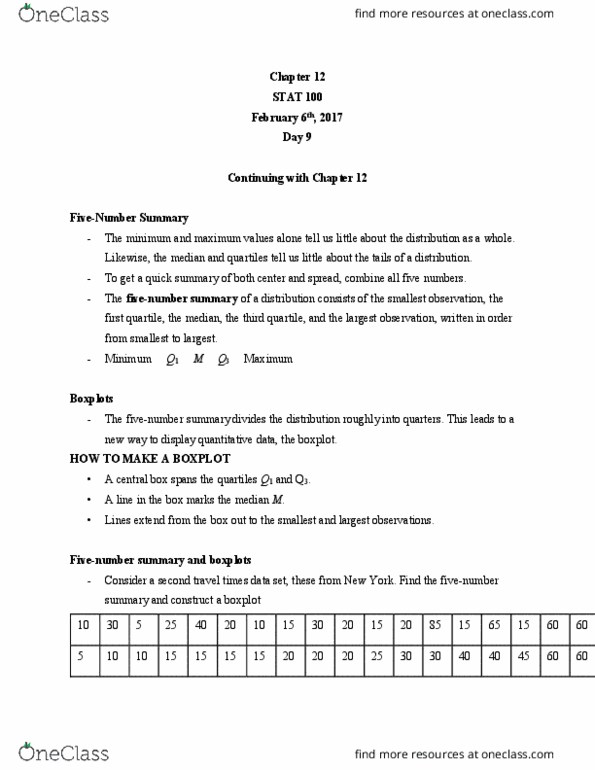
5 Number Summary
- Minimum Q1 Q2 Q3 Max—positional data information
- Q2= medium or 50th percentile
- If my data lies within the fences, then no outliers
o For the lower fence- range of first quartile, and subtract 1.5 x IQR
▪ LF= Q1-1.5xIQR
• If more to the left, then it is an outlier
o For the upper fence, third quartile length, and add 1.5 IQR
▪ UF= Q3+1.5xIQR
• If it is out, then outlier
- Should be used to describe center and spread fro skewed distribution or when outliers
are present
Boxplot—graphical representation of a 5 number summary
If my data has several outliers, the better measure of center is the median.
Outliers are extreme observation in the data
- They are values that are significantly too high or too low, based on spread of data
- Should be identified and investigated
- They are not necessarily invalid data
- One way to check for outliers uses the quartiles
Outliers can be:
- Chance occurrences
find more resources at oneclass.com
find more resources at oneclass.com
Document Summary
Difference between the first and third quartile q3-q1. Minimum q1 q2 q3 max positional data information. If my data lies within the fences, then no outliers: for the lower fence- range of first quartile, and subtract 1. 5 x iqr, lf= q1-1. 5xiqr. If more to the left, then it is an outlier: for the upper fence, third quartile length, and add 1. 5 iqr, uf= q3+1. 5xiqr. Should be used to describe center and spread fro skewed distribution or when outliers are present. If my data has several outliers, the better measure of center is the median. They are values that are significantly too high or too low, based on spread of data. One way to check for outliers uses the quartiles. Fence rule- for checking for outliers using the quartiles: calculate lower and upper fences, lower fence= lf= q1- (1. 5xiqr, upper fence- uf= q3+ (1. 5xiqr)