GEOG 473 Lecture Notes - Lecture 9: Statistical Inference, Test Statistic, Ghost Hunting

5 Jul 2018
School
Department
Course
Professor

I. Density and Cluster
A. Spatial Patterns
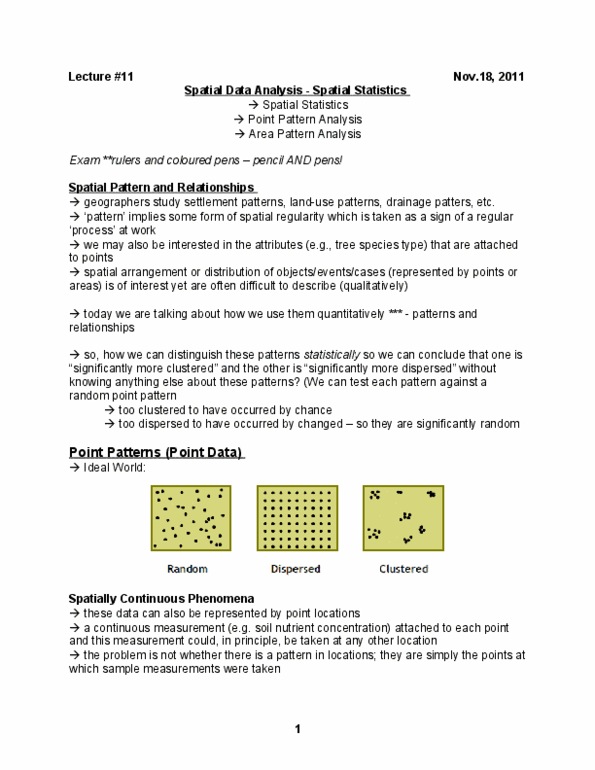
Points: their patterns could be random (equally likely to occur at any location),
dispersed (far away from each other as possible), or clustered (concentrated close
together in one or more regions)
First-order: An observation occur at a place due to the underlying properties of the
local “environment” of the place. Measured via density-based analysis tools (quadrat
count analysis, kernel-density estimation, trend surface analysis)
Second-order: The existence of an observation is due to interactions with other
observations. (What is left of the pattern once first order variation or trend effects
have been removed); Can be measured by distance-based analysis tools (mean
nearest-neighbor distance index, spatial autocorrelation, distance functions
B. Quadrat Count Analysis
Function: Measures the density of points (the whole area is separated into quadrats)
Measures dispersion, not really pattern because it does not consider points’ spatial
interrelation. Local variations are not recognized
The parameters of the quadrat must be defined first (shape and size)
Quadrat size, orientation and arrangement influence the results.
Size of square quadrats:
1. Poisson distribution
Commonly used to describe a random spatial pattern.
Only occurs when either:
a. The probability of observing a single event over a small interval (a time
interval or an area) is approximately proportionalto the size of that interval.
b. The probability of two events occurring in a small enough interval is
negligible.
c. The probability of an event within a certain interval does not change over
different intervals (homogenous).
d. The probability of an event in one interval is independentof the probability
of an event in any other non-overlapping interval.
In quadrat count analysis, P(r) is the probability that r points occur in a
quadrat.
find more resources at oneclass.com
find more resources at oneclass.com
Document Summary
Points: their patterns could be random (equally likely to occur at any location), dispersed (far away from each other as possible), or clustered (concentrated close together in one or more regions) First-order: an observation occur at a place due to the underlying properties of the local environment of the place. Measured via density-based analysis tools (quadrat count analysis, kernel-density estimation, trend surface analysis) Function: measures the density of points (the whole area is separated into quadrats) Measures dispersion, not really pattern because it does not consider points" spatial interrelation. The parameters of the quadrat must be defined first (shape and size) Quadrat size, orientation and arrangement influence the results. Commonly used to describe a random spatial pattern. In quadrat count analysis, p(r) is the probability that r points occur in a quadrat. The kolmogorov-smirnov (k-s) test can compare distributions: mean nearest-neighbor index. It measures how similar the mean nearest-neighbor (nn) distance is to an expected mean.