BMGT 230 Lecture Notes - Lecture 3: Marginal Distribution, Contingency Table, Bar Chart

27 Sep 2016
School
Department
Course
Professor
Document Summary
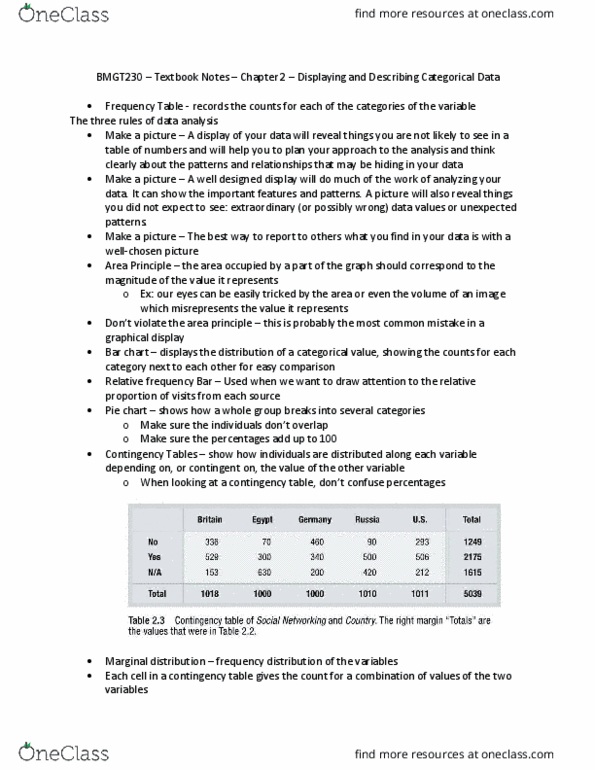
The three rules of data analysis: make a picture. A well-designed display will do much of the work of analyzing your data: make a picture. The best way to report to others what you find in your data is with a well- chosen picture. Frequency table (relative frequency table): a table that lists the categories in a categorical variable and gives the number (the percentage) of observations for each category. The row percent is the proportion of each row contained in the cell of a frequency table, while the column percent is the proportion of each column contained in the cell of a frequency table. Distribution: the distribution of a variable is a list of: all the possible values of the variable, the relative frequency of each value. Note: when computing a relative frequency table, the total percent may not actually add up to 100% due to rounding.