33:799:301 Lecture 7: 0007-IntrotoSupplyChain-2017-02-28

5 Mar 2017
School
Department
Course
Professor
Document Summary
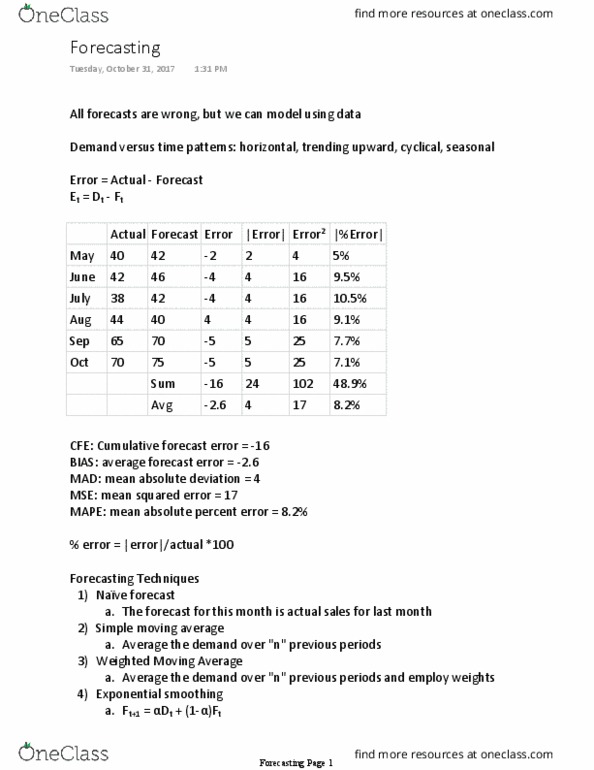
Mean absolute deviation (mad) - identifies how far off the forecast was in absolute terms. It is calculated as the average of the absolute errors where et = forecast error for period t. Mean absolute percentage error (mape)- provides a perspective of the true magnitude of the forecast error, it measures the size of the error in percentage terms. It is calculated as the average of the absolute error percentages. where et = forecast error for period t. At = actual demand for period t; n = number of periods of evaluation. Mean squared error (mse)- magnifies the errors by squaring each one before adding them up and dividing by the number of forecast periods. Where et = forecast error for period t n = number of periods of evaluation. Forecast bias is a consistent deviation from the mean in one direction; either high or low. In other words, bias exists when the demand is consistently over- or under-forecast.