01:640:111 Lecture Notes - Lecture 8: Floor And Ceiling Functions, Piecewise, Constant Function

30 Dec 2019
School
Department
Course
Professor
Document Summary
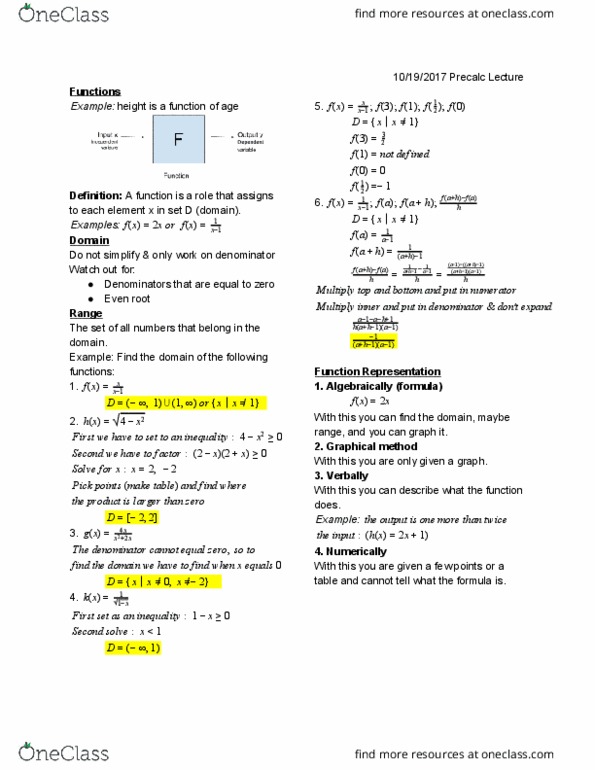
= b where b is a given number and the graph represents a horizontal f which represents a slope of m and a y-intercept of b. To graph a function, we plot the points (x, f(x)) in a coordinate plane. The points (x,y) whose x-coordinate is an input and whose y-coordinate is the corresponding output of the function. If f is a function with domain a, then the graph of f is the set of ordered pairs: (x, (x))|x. Then we plot the points given by the table and joined them by a smooth curve to obtain the graph. Example 2: graphing a function with a graphing calculator. To graph a function, we must graph it when the equation is equal to y. To graph a function, we graph it when the equation is equal to y. The general shape of the graph depends on whether n is even or odd.