STAT 200 Lecture Notes - Lecture 2: Percentile, Quartile, Interferon Gamma

Document Summary
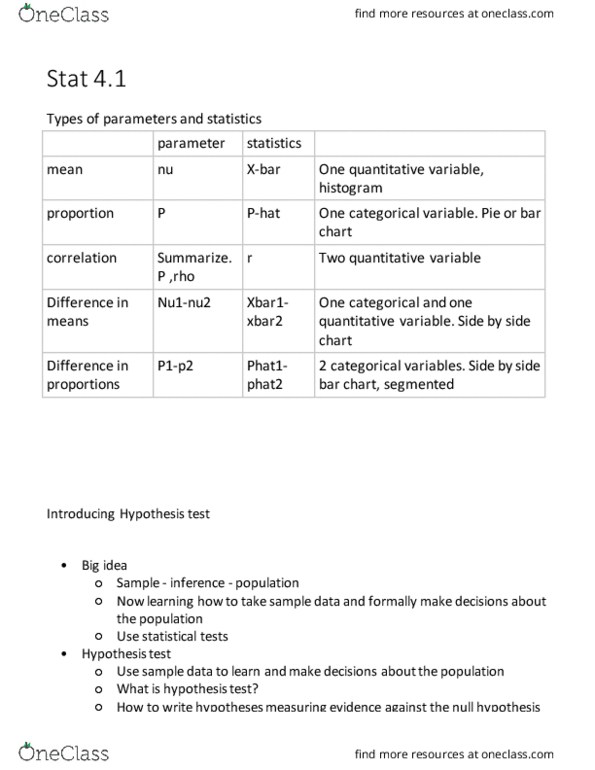
Frequency table: a frequency table shows the number of cases that fall in each category. Relative frequency table: a relative frequency table shows the proportion of cases that fall in each category, all of the numbers in a relative frequency table sum to 1. The proportion in a category is found by. Proportion = number in category / total sample size. Proportion for a sample: p^ p - hat . Bar chart/plot/graph: in a bar plot, the height of the bar corresponds to the number of cases falling in each category. Pie chart: in a pie chart, the relative area of each slice of the pie corresponds to the proportion in each category. We are looking at the relationship between two categorical variables. Which combination is most meaningful: survival and gender, survival and sexual activity, sexual activity and gender. A difference in proportions is a difference in proportions for one categorical variable calculated for different levels of other categorical variable.