PSYCH 2220 Lecture Notes - Lecture 4: Xm Satellite Radio, Frequency Distribution, Unimodality

8 Feb 2018
School
Department
Course
Professor
Document Summary
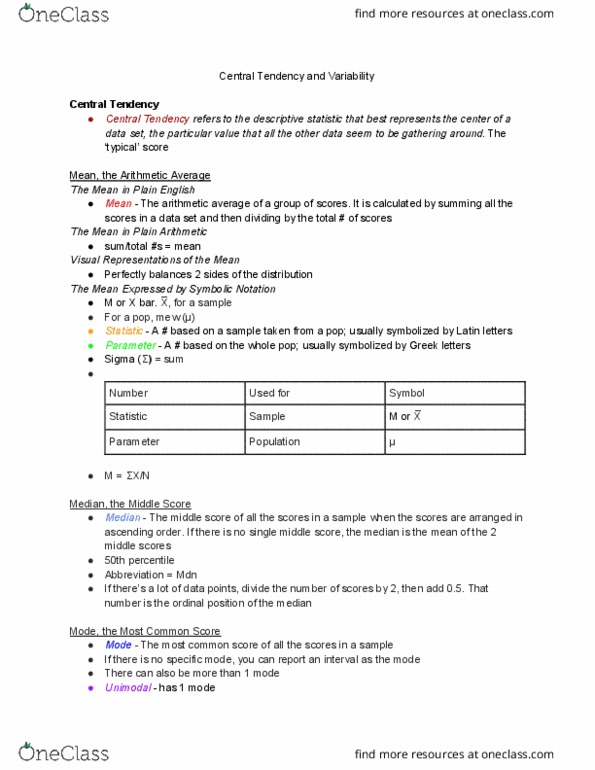
#s that tell us about the center of a distribution. W/ a normal curve, the mean, median, and mode are all the same value. Add scores, divide by # of scores. Median location: (n / 2) + 0. 5 or (n +1) / 2. 49 numbers 49/2 +0. 5 = 25th number. 50 numbers 51/2 = average of 25. 5th number, average b/t 25th and 26th number. 1 7 7 8 8 10 take average. 2 non-adjacent modes report both, bimodal. Can be useful bc it is an actually occurring score. Can use for ordinal, interval, or ratio data. Not very stable from sample to sample. Can be manipulated algebraically - in equations. More stable across samples - better estimate of pop mean. Where the mode, median, and mean are located relative to each other depends on shape of the frequency distribution. Unimodal m = md = mo. Modes at the top of each curve. Mean has to balance out the values.