ACMS10145 Lecture Notes - Lecture 2: Statistical Inference, Categorical Variable, Contingency Table

28 Aug 2020
School
Department
Course
Professor

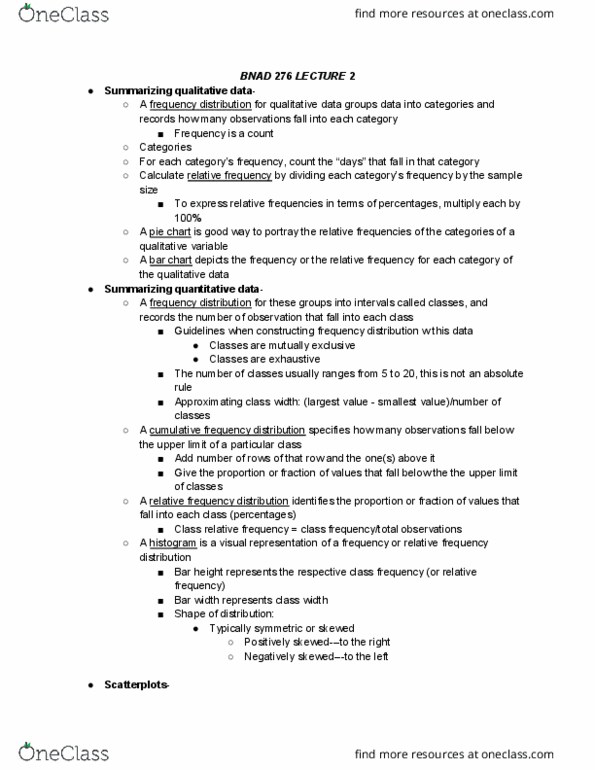
● Descriptive stats provide quick and efficient data summaries
○ Are different from inferential statistics
● Categorical data summarizing:
○ Does it make sense to calculate the average of this variable?
○ Data has to be classified according to categories
○ Can calculate frequency, relative frequency, of percentages of observed data
○ Class frequency: number of observations in a data set that are in the same class
○ Class relative frequency: class frequency divided by total number of observations
○ Class percentage: relative frequency X 100
● Example 1:
N =20 (sum of all frequencies)
Item
Frequency
Relative Freq.
Percent
Poor
2
0.1
10
Below Average
3
0.15
15
Average
5
0.25
25
Above Average
9
0.45
45
Excellent
1
0.05
5
𝑅𝑒𝑙𝑎𝑡𝑖𝑣𝑒 𝐹𝑟𝑒𝑞𝑢𝑒𝑛𝑐𝑦 = 𝑓𝑟𝑒𝑞𝑢𝑒𝑛𝑐𝑦/𝑁(sum of all must equal 1)
𝑃𝑒𝑟𝑐𝑒𝑛𝑡 = 𝑅𝑒𝑙𝑎𝑡𝑖𝑣𝑒 𝑥100(sum must equal 100)
● Pie Charts
○ The size of the slice representing each class is proportional to the class relative
frequency
○ Numbers are added in ascending order
○ Crucial to have distinct classes (all inside percentages must add to 100)
● Bar graphs
○ Classes are represented by bars (height = class frequency/relative freq./%)
○ The bases of all bars are in equal width
● Quantitative Data Summarizing
○ Histograms