MATH 109 Lecture Notes - Lecture 5: Empirical Probability, Box Plot, Quartile


The Boxplot
- It is a graphic summary.
- It provides a visual display of numerical summaries of a distribution of numerical data.
- HOW? The box stretches from the first quartile to the third quartile, and a vertical line
indicates the median. Whiskers extend to the largest and smallest values that are not
potential outliers, and potential outliers are indicated with special marks.
- HOW IS IT USED? Boxplots are useful for comparing distributions of different groups of
data.
5.1
●Random- no predictable pattern occurs and that no digit is more likely to appear than
any other.
●Probability- used to measure how often random events occur.
○ Probabilities are defined as relative frequency.
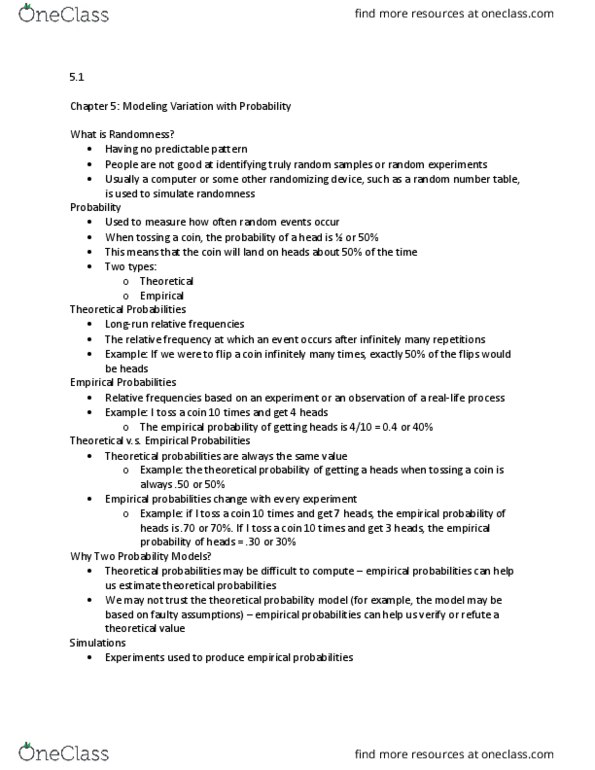
Theoretical and Empirical Probability
Theoretical Probability- the relative frequency at which an event happens after infinitely
many
repetitions.
- Theoretical Probabilities are long-run relative frequencies.
-Example: a coin has 50% probability of coming up heads, we mean that if it were
possible to flip the coin infinitely
many times, then exactly 50% of the flips would be
heads.
- “What should happen.”
- Theoretical Probabilities are NOT based off experiments.
Empirical Probability- the relative frequency based on an
experiment or on observations of a
real-life process.
-Example: My empirical probability of getting heads is therefore or 60%.
6
10
KEYPOINT: Empirical probabilities tell us how often an event occurred in an actual set of
experiments or observations. Theoretical probabilities are based on theory and tell us
how many times an event would occur is an experiment were repeated infinitely
many
times.
Why do we need both?
Simulations- experiments used to produce Empirical probabilities, because the investigators
hope that those experiments simulate the situation they are examining.
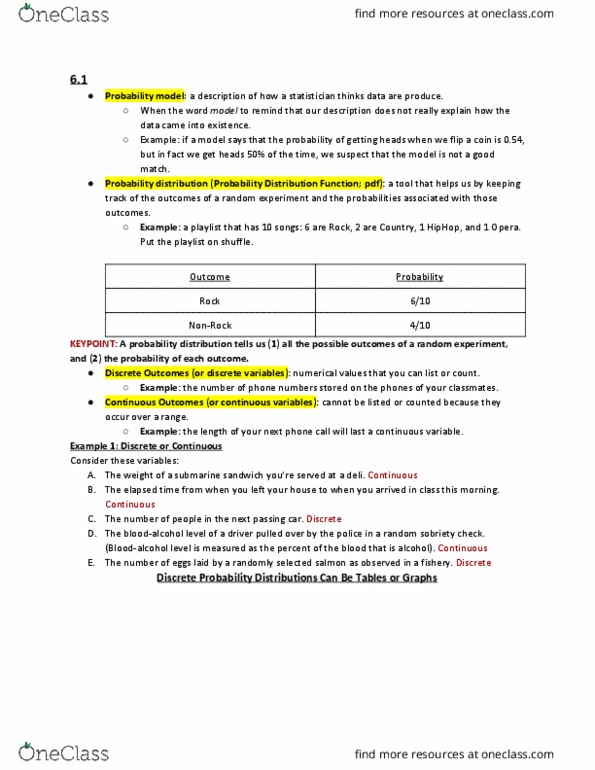
Document Summary
It provides a visual display of numerical summaries of a distribution of numerical data. The box stretches from the first quartile to the third quartile, and a vertical line indicates the median. Whiskers extend to the largest and smallest values that are not potential outliers, and potential outliers are indicated with special marks. Boxplots are useful for comparing distributions of different groups of data. Random- no predictable pattern occurs and that no digit is more likely to appear than. Probability- used to measure how often random events occur. any other. Theoretical probability- the relative frequency at which an event happens after infinitely many repetitions. Example : a coin has 50% probability of coming up heads, we mean that if it were possible to flip the coin infinitely many times, then exactly 50% of the flips would be heads. Empirical probability- the relative frequency based on an experiment or on observations of a real-life process.