MATH 10041 Lecture Notes - Lecture 10: Standard Deviation, Graphing Calculator

2 Apr 2019
School
Department
Course
Professor
Document Summary
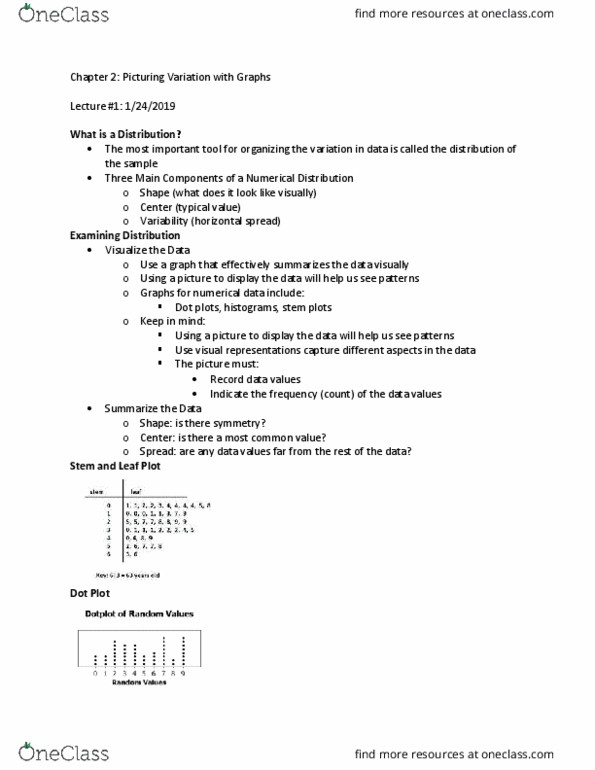
3. 1: summaries for symmetric distributions: measure for center (balance point): mean, measure of horizontal spread (variability): standard deviation. Appropriate measures: recall, when dealing with numerical data, you need to describe the distribution using these 3 characteristics: The mean: can be thought of as the balancing point of the distribution . Using the mean to describe typical values: the mean represents a typical value in a set of data when the data is roughly symmetric, for skewed distributions, the mean is not a good estimate of a typical value. Computing the mean: for small data sets, add data values, divide by number of numbers, for larger data sets, use some kind of appropriate technology, we"ll use statcrunch and the ti*84 graphing calculator. Deviation: the deviation of a data value is its distance from the mean. Less spread out (data values closer to the center)