MATH 10041 Lecture Notes - Lecture 5: Bar Chart

31 Jan 2019
School
Department
Course
Professor
Document Summary
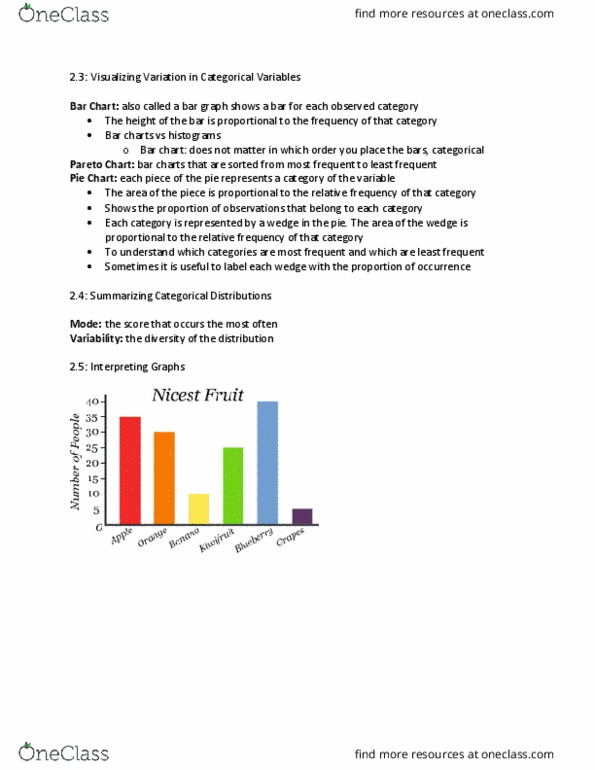
A bar chart is different than a histogram: in a bar chart, the bars do not touch, the order does not matter in a bar chart. Visualizing data: bar chart: similar to a histogram, record data categories textbook. Pareto chart: a bar graph in which the bars are arranged from tallest to shortest (highest frequency to the lowest frequency) Pie chart: a circle divided into pieces, the area of each piece is proportional to the relative frequency, or percent, of the data in that piece. Variability is more about the occurrence of many different values.