MATH 10041 Lecture Notes - Lecture 12: Probability Distribution Function, Probability Distribution

15 Oct 2018
School
Department
Course
Professor
Document Summary
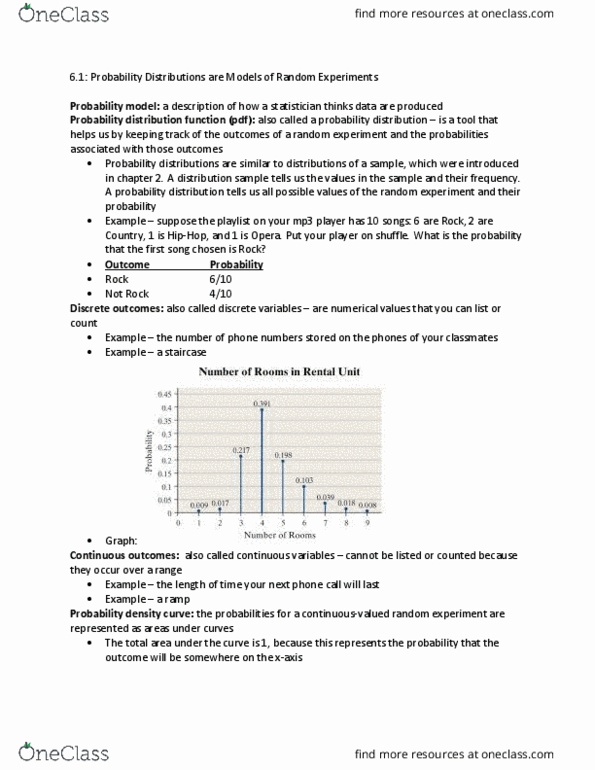
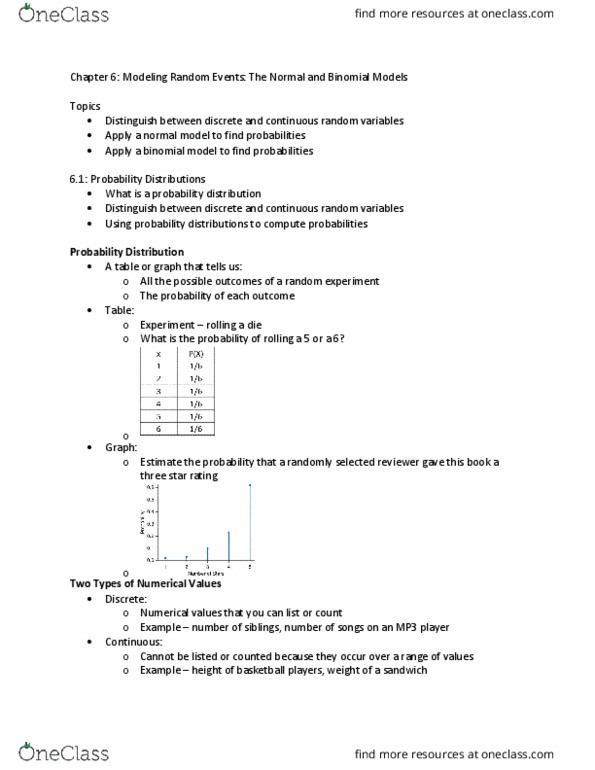
6. 1- probability distributions are models of random experiments. Probability model- description of how we think the data is produced. Probability distribution- tells us all the possible outcomes of a random experiment and the probability of each outcome. Discrete outcomes- numerical values that you can list or count. Ex. number of contacts on cell phone per person in your cass. Continuous outcomes- cannot be listed or counted because they occur over a range. Ex. the length of time your next phone call will last. If we can list the outcomes, as we can for discrete variables, then it is easier to display the pdf (unlike continuous with an infinite number of outcomes) Probability density curve- the graphical representation of a continuous variable. Continuous probability represented as the area under the curve. Cannot list all possible values we might see, so we use the curve. Total area under the curve = 1.