STAT-S 300 Lecture Notes - Lecture 4: Standard Score, Standard Normal Deviate, Standard Deviation


Section 2.2 Notes- Normal Distributions 9-7-13
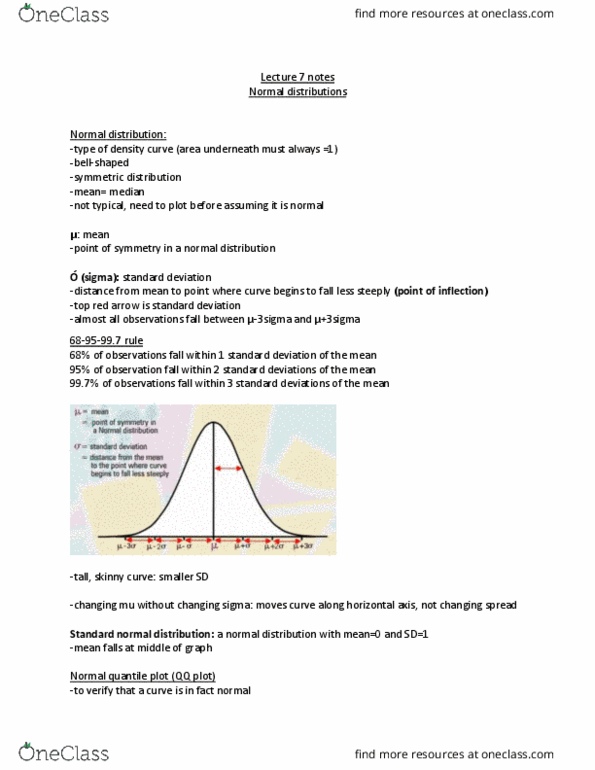
• Normal curve describes normal distribution
o Same overall shape- symmetric, unimodal, bell-shaped
o Any specific normal curve is completely described by giving mean (μ) and
standard deviation (σx)
o Mean at center of symmetric curve, same as median
o Before graph would go straight down, slope gets flatter rather than steeper as you
go out and down
▪ Inflection points- Points at which this change occurs are located σ (1
standard deviation) on either side of mean μ
o Normal distribution abbreviated with mean and standard deviation as N(μ, σ)
• The 68-95-99.7 Rule
o In normal distribution with mean μ and standard deviation σ:
▪ Approx. 68% of observations fall within σ of mean μ
▪ Approx. 95% of observations fall within 2σ of mean μ
▪ Approx. 99.7% of observations fall within 3σ of mean μ
▪
• The Standard Normal Distribution
o Standard normal distribution- normal distribution with mean 0 and standard
deviation 1
▪ If a variable x has any normal distribution N(μ, σ) with mean μ and
standard deviation σ, then standardized variable z = x – μ/σ has the normal
standard distribution
o Standard normal density curve- take normal distribution and find z-score for
each value in data set
o Standard normal table- Table A is table of areas under standard normal curve
▪ Table entry for each value z is area under curve to left of z
find more resources at oneclass.com
find more resources at oneclass.com