GEOG 106 Lecture Notes - Lecture 24: Urban Ecology, Human Ecology, Artificial Life

Document Summary
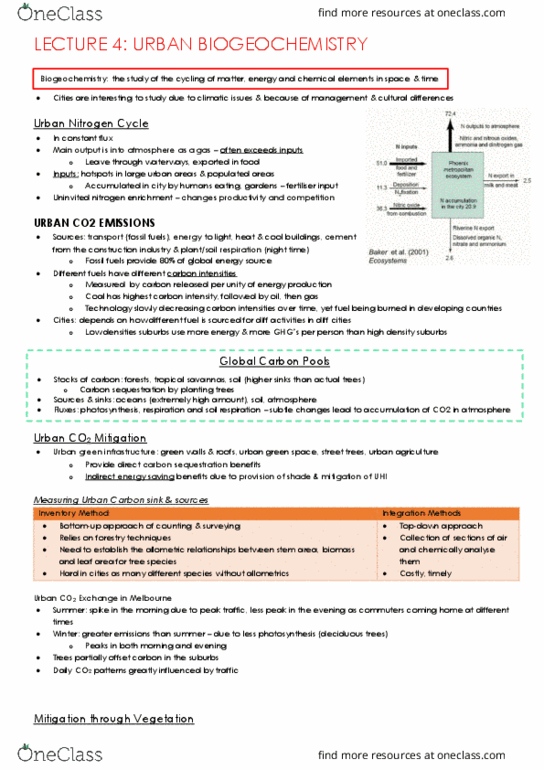
The population density of major cities rank mexico city, moscow and tokyo among the highest. The carbon-dioxide emissions of world cities is highest in los angeles, new york, There are ways of co2 emissions: traffic or buildings. Heating demand (outdoor temperatures) controlled emissions from buildings, secondary effects are space consumption, density, cooling demand and technology. Density controlled emission from automobile transport-commuting distances and mode of transport. Inputs are food, resources and fuels (easiest to measure). Emissions and uptakes are atmospheric co2 but these are challenging to measure. The inputs passes through the neighbourhood (storage change) then outputs. Per city: co2 emissions per city and time (kg co2 yr-1). Per capita: co2 emissions per capita and time (t co2 cap-1 yr-1). Kt co2 is 1 t = 1 tonne = 1000 kg. 1 kt = 1000 tonne = 1000 x 1000 kg = 1,000,000 kg. Example: for a city, calculate co2 emissions per capita from fuel consumption in buildings.