QTM 100 Lecture 21: Lecture 21 Notes

10 Aug 2016
School
Department
Course
Professor
Document Summary
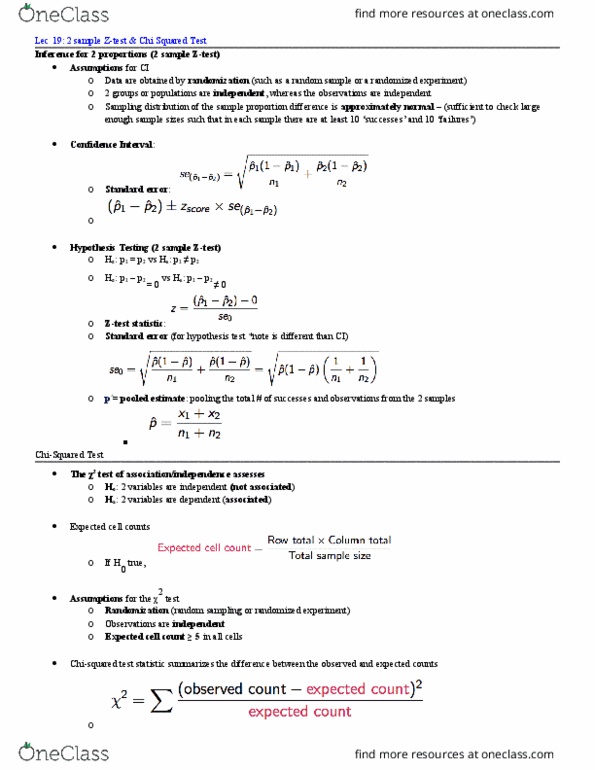
Lecture 21: association, correlation and simple linear regression. Fisher"s exact test can be used instead of the chi-squared test when expected cell counts are less than 5. Can be used for a general r c table, but calculations may take longer for tables bigger than 2 2. Take longer for tables bigger than 2 2. Measures to summarize the strength of the association: difference of means: (x 1 x 2, difference of proportions: (p 1. P 2: relative risk - a ratio of proportions: p 1/ p 2. For rare events, relative risk may be more appropriate than difference in proportions. : the two variables are independent (not associated) vs. h. : the two variables are dependent (associated) a. Small p-values mean you have strong evidence of association between two variables: small p-values do not mean you have evidence of a strong association between two variables. Large p-values mean there is no evidence of an association.