PSYC 110 Lecture Notes - Squared Deviations From The Mean, Naturalistic Observation, Psychometrics

14 Jun 2018
School
Department
Course
Professor

1/24
Psychometrics
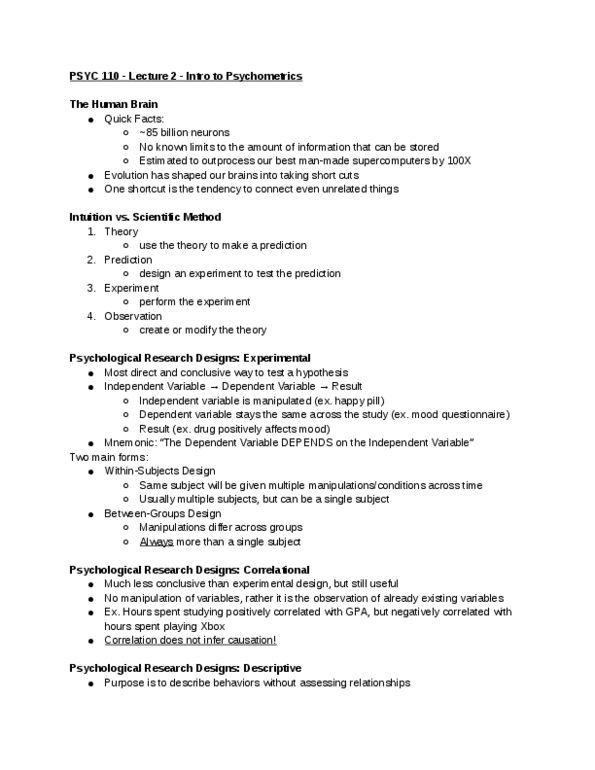
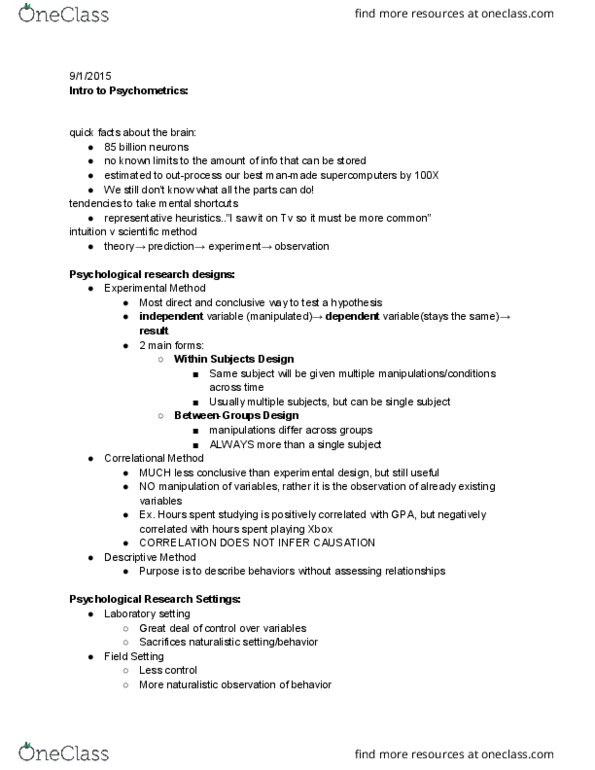
Human brain has 100 billion neurons
No known limits to amount of info that can be stored in it
Estimated to out-process our best man-made supercomputers by 100x
Still not known about all it can do
Evolution has shaped our brains into taken shortcuts
One shortcut is the tendency to connect even unrelated things
Intuition vs Scientific Method
Psychological Research Designs: Experimental
-Most direct and conclusive way to test a hypothesis
Independent variable (Happy pill; gets manipulated)->Dependent Variable (Mood questionnaire;
stays the same across the study)->Result (Drug positively affects mood)
Two main forms: within-subjects design; same subject will be given multiple
manipulations/conditions across time. Usually multiple subjects, but can be a single subject
Between-groups design: manipulations differ across groups; ALWAYS more than a single subj
Psychological Research Designs: Correlational
-Much less conclusive than experimental design, but still useful.
NO manipulation of variables, rather it is the observation of already existing variables.
CORRELATION DOESN’T INFER CAUSATION
Psychological Research Designs: Descriptive
-Purpose is to describe behaviors without assessing relationships
Psychological Research Settings
-Lab Setting
Great deal of control over variables
Sacrifices naturalistic setting/behavior
-Field Setting
Less Control
More naturalistic observation of behavior
Either setting can use self-report or observational data collection
How do we use stats?
Two Categories: Descriptive and Inferential
We use stats both to describe data as basis for inferences
Descriptive Stats
Mathematical methods used to organize and summarize or describe data
-Measure of Central Tendency-
Standard Deviation: the square root of the sum of the squared deviations from the mean divided
by the scores in the distribution.
A theoretical distribution that is symmetrical with the mean, median, and mode all falling at the
exact middle of the distribution
Sometimes called a bell curve or a standard normal curve/distribution
Inferential Stats
Math methods used to draw conclusions about a population based on a sample of data
find more resources at oneclass.com
find more resources at oneclass.com
Document Summary
No known limits to amount of info that can be stored in it. Estimated to out-process our best man-made supercomputers by 100x. Evolution has shaped our brains into taken shortcuts. One shortcut is the tendency to connect even unrelated things. Most direct and conclusive way to test a hypothesis. Independent variable (happy pill; gets manipulated)->dependent variable (mood questionnaire; stays the same across the study)->result (drug positively affects mood) Two main forms: within-subjects design; same subject will be given multiple manipulations/conditions across time. Usually multiple subjects, but can be a single subject. Between-groups design: manipulations differ across groups; always more than a single subj. Much less conclusive than experimental design, but still useful. No manipulation of variables, rather it is the observation of already existing variables. Purpose is to describe behaviors without assessing relationships. Either setting can use self-report or observational data collection. We use stats both to describe data as basis for inferences.