STS 110 Lecture Notes - Lecture 8: Normal Distribution, Standard Deviation

27 Mar 2018
School
Department
Course
Professor
Document Summary
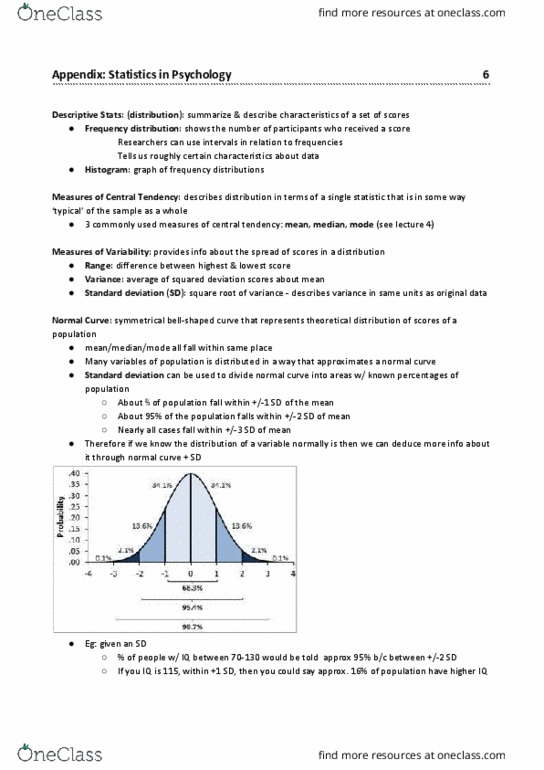
1- understand the basics of a normal curve. Bell-shaped = normal = normally distributed = normal curve = approximately normal. Most of the data is clustered around the mean. Graphs a,b, c (look at written notes) Ex 1: iq scores (look at written notes) The probability that a randomly chosen person"s iq is between 85-115 is 0. 68. 68% of all people have an iq score between 85 and 115. 68% of the data falls within 1 sd of the mean. 95% of the data falls within 2 sd of the mean. 99. 7% of the data falls within 3 sd of the mean. Z scores: used to compare values from di erent bell shaped data. Tells you how may standard deviations from the mean a value is. Rachel: sat 1220 1220-1083/ 174 = 137/174 = 0. 787. Lauren: act 22 22- 20. 8/ 4. 8 = 1. 2/ 4. 8 = 0. 25.