ECO 305 Lecture Notes - Lecture 2: Composite Good


This preview shows half of the first page of the document.
Unlock all 1 pages and 3 million more documents.
Document Summary
Get access


Related textbook solutions


Related Documents
Related Questions
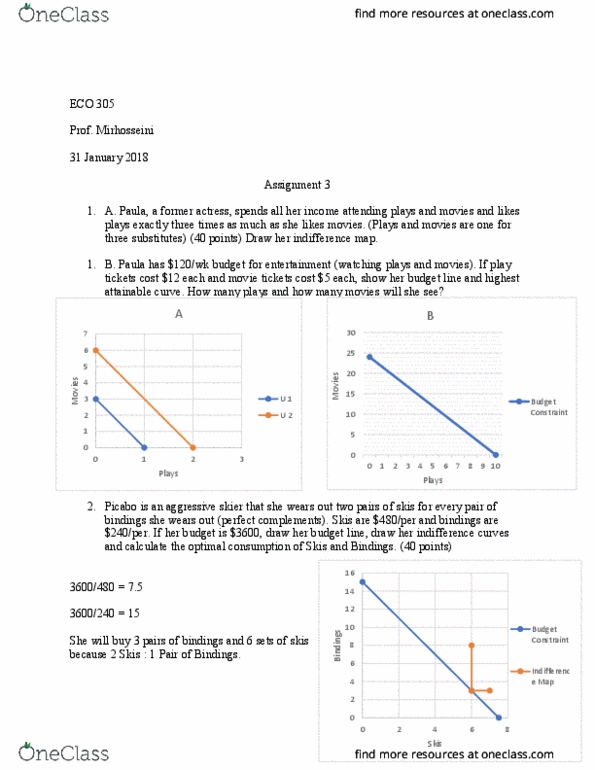
1) Suppose your grandmother gave you $25 for your birthday and you decided to spend all of it on candy bars and bags of popcorn. The price of candy bars is $1.25 and price of a bag of peanuts is $3.75.
a) Construct a table showing the alternative combinations of the two products that are available.
b) Plot the data in your table as a budget line in a graph. What is the slope of the budget line? What is the opportunity cost of one more candy bar? Of one bag of peanuts?
c) How, in general, would you decide which of the available combinations of candy bars and bags of peanuts to buy?
2) With current technology, suppose a firm is producing 750 screwdrivers daily. Also assume that the least-cost combination of resources in producing those screwdrivers is 15 units of labor, 20 units of land, 4 units of capital, and 3 unit of entrepreneurial ability, selling at prices of $50, $45, $75, and $50, respectively. If the firm can sell these 750 screwdrivers at $2.50 per unit,
a) what is its total revenue?
b) what is its total cost?
c) what is its profit or loss?
d) will it continue to produce screwdrivers?
e) If this firmâs situation is typical for the other makers of screwdrivers, will resources flow toward or away from this product?
3) How will each of the following changes in demand and/or supply affect equilibrium price and equilibrium quantity in a competitive market; that is, do equilibirium price and quantity rise, fall , or are the answers indeterminate because they depend on the magnitudes of the shifts?
a)Supply decreases and demand is constant. Change in eqilibrium price chnage in eqilibrium quantity
b)Demand decreases and supply is constant.
c)Supply increases and demand is constant.
d)Demand increases and supply increases.
e)Demand decreases and supply decreases.
4)Zeke likes to go to music concerts. The number of times per year that he attends concerts depends on both the price of the concerts as well as Zekeâs income and the cost of other types of entertainmentâin particular, how much it costs to go see a movie instead of attending concerts. The three demand schedules in the $60,000 per year and movies cost $10 each. In scenario D2, Zeke's income is also $60,000 per year, but the price of seeing a movie rises to $12. And in scenario D3, Zeke's income goes up to $80,000 per year, while movies cost $12.
a)Using the data under D1 and D2, calculate the cross-elasticity of Zeke's demand for concerts at all three prices. (To do this, apply the midpoints approach to the cross-elasticity of demand.) Is the cross-elasticity the same at all three prices? Are movies and concerts substitute goods, complementary goods, or independent goods?
b)Using the data under D2 and D3, calculate the income elasticity of Zeke's demand for concerts at all three prices. (To do this, apply the midpoints approach to the income elasticity of demand.) Is the income elasticity the same at all three prices? Are concerts an inferior good?
| PRICE | D1 | D2 | D3 |
| 50 | 10 | 5 | 12 |
| 40 | 15 | 10 | 25 |
| 30 | 25 | 15 | 40 |
Income 60,000 60,000 80,000
Cost of revenue 10 12 12
5) On the basis of the three individual demand schedules below, and assuming these three people are the only ones in the society, determine (a) the market (a) the market demand schedule on the assumption that the good is a private good and (b) the collective demand schedule on the assumption that the good is a public good.
| P | Qd(D1) | Qd(D2) | Qd(d3) |
| 20 | 0 | 0 | 1 |
| 19 | 0 | 1 | 2 |
| 17 | 0 | 2 | 3 |
| 16 | 0 | 3 | 4 |
| 15 | 1 | 4 | 5 |
| 14 | 2 | 5 | 6 |
| 13 | 3 | 6 | 7 |
| 12 | 4 | 7 | 8 |
| 11 | 5 | 8 | 9 |
| 10 | 6 | 9 | 10 |

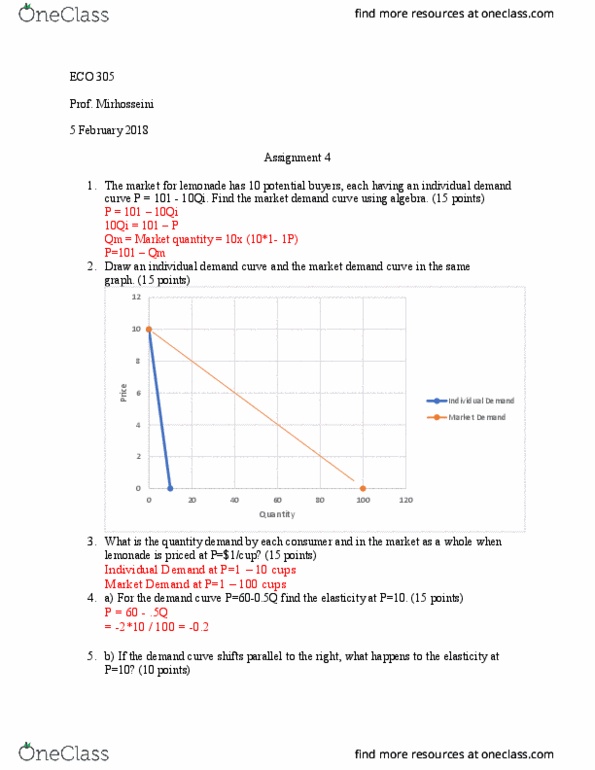
Q1. The following table shows the relationship between outside temperature (T) and number of hot drinks sold (Q).
| Outside temperature (T) | Number of hot drinks sold(Q) |
| 0 0F | 1000 cups |
| 20 | 900 |
| 40 | 800 |
| 60 | 700 |
| 80 | 600 |
a. Graph and briefly explain the relationship. Put the number of hot drinks sold (Q) on the vertical axis and outside temperature (T) on the horizontal axis.
b. Compute the slope of the line? Y-intercept? Show your work.
c. Construct the equation that represents this line. Predict the number of hot drinks sold (Q) at 26 0F. Show your work.
Q2. Discuss the opportunity costs of the following cases, respectively.
a .Go to the movie theater and watch a movie instead of studying for a midterm exam.
b .Suppose that an economyâs PPF is a straight line, rather than a concave curve. What would this say about the nature of marginal opportunity cost as production is shifted from one good to the other?
Q3. Dreamlandâs production possibilities schedule is as follows:
~~~~~~~~~~~~~~~~~~~~~~~~~~~~~~~~~~~~~~~~~~~~~~~~~~~~~~~~~~~
| POINT | Capital Goods | Consumption Goods |
| A | 0 | 30 |
| B | 2 | 27 |
| C | 4 | 21 |
| D | 6 | 12 |
| E | 8 | 0 |
~~~~~~~~~~~~~~~~~~~~~~~~~~~~~~~~~~~~~~~~~
a. Draw the production possibilities frontier. Put Capital Goods on the horizontal axis and Consumption Goods on the vertical axis.
b. If this economy is at point C, what is the opportunity cost of one more capital good (i.e., marginal opportunity cost)?
c. Can Dreamland produce 6 capital goods and 21 consumption goods? Explain.
d. Suppose that Dreamland has two possible choices in the future: it devotes only 5% of its resources to producing capital goods over each of the next 10 years, whereas it devotes 20%. In which case is Dreamland likely to experience more rapid economic growth in the future? Explain your reasoning.
