STAT-2300 Lecture Notes - Lecture 6: Box Plot, Quartile, Unimodality

3 Mar 2017
School
Department
Course
Professor
Document Summary
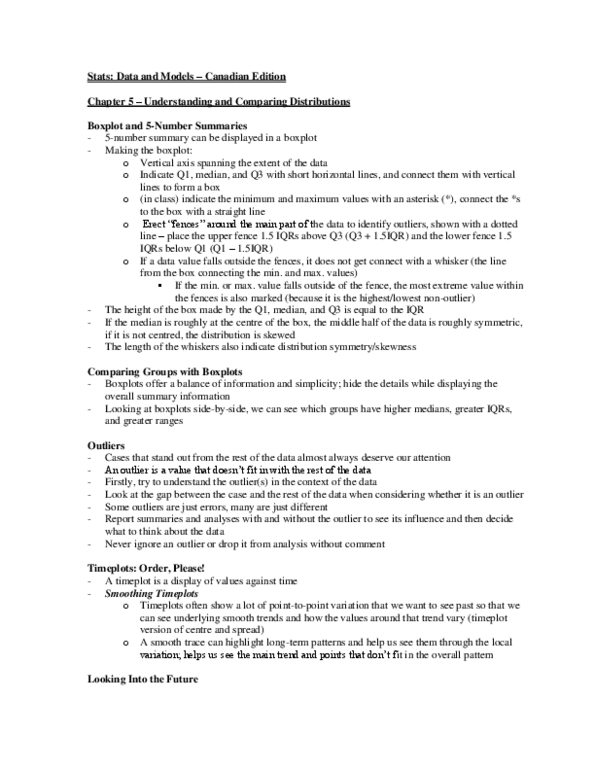
A boxplot is a graph that shows the five number summary for collection of observations. Boxplots should not be used for small data sets. There are 5 different measures used, which means there has to be enough observations to determine these 5 measures. Boxplots are best used for unimodal distributions because they hide modality. Comparing boxplots is the same as comparing any other distributions, where you analyze the shape, center, and spread of the data. Provide a measure of center for each distribution, and discuss which one is larger or smaller. Provide a measure of spread, and discuss which one is larger or smaller. Always use the same measures of center and spread for the distributions being compared. If any one group is strongly skewed or has outliers, it"s usually (cid:271)est to (cid:272)o(cid:373)pare usi(cid:374)g the (cid:373)edia(cid:374)s and iqrs because the means and standard deviations only best represent symmetric distributions.