CHEM 11200 Lecture Notes - Lecture 18: Reaction Rate, Triple Point, Phase Diagram

19 Jul 2020
School
Department
Course
Professor
Document Summary
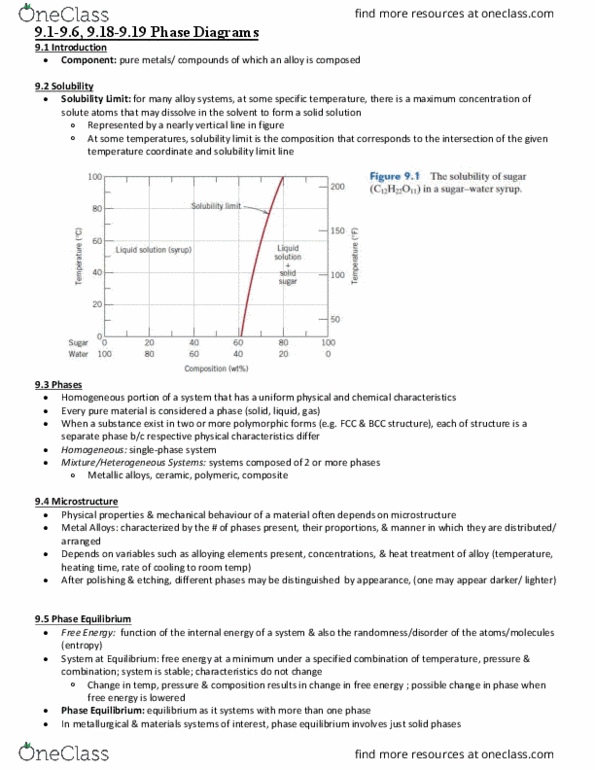
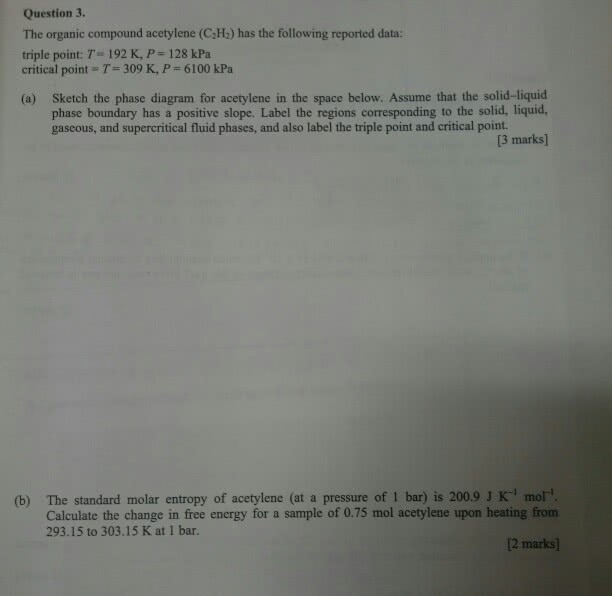
C= specific heat (the mc variable can also = c (heat capacity) ) Specific heat of a substance also depends on the phase (solid, liquid, gas) Conversion between calories and joules is 1 cal = 4. 2 j (units for q) Plots the temperature of the sample versus the amount of heat absorbed. Places where the line/curve is horizontal indicated a phase change. The phase diagram demonstrates the temperature and pressure combinations to create each phase. Boundary lines = places where two phases exist = transition states. Triple point = where all three phases exist. Critical point = point after which the supercritical fluid has both liquid and gas properties. Kinetics: study of how reactions take place and how fast they occur. We can better understand the kinetics of a reaction by breaking down each. Kinetics reaction into several elementary steps and their intermediates. C d (where b and c are intermediates)