STAT W21 Lecture Notes - Lecture 7: Scatter Plot, Data Cluster, Homoscedasticity

Document Summary
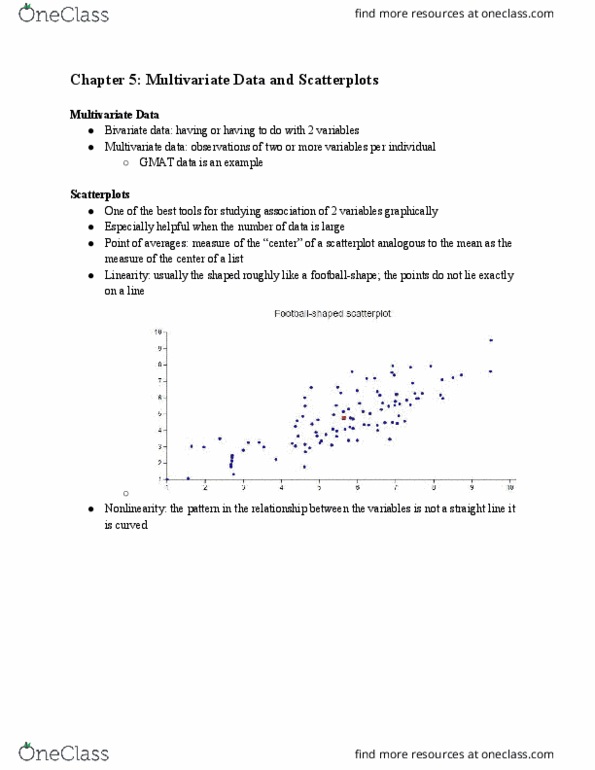
Quantitative measure of association that tells us whether the scatterplot tilts up or down and how tightly the data cluster fits around a straight line. Only appropriate for quantitative variables, not ordinal or categorical variables. Secular trend: in both variables manifests as a correlation between them. If the data no do not cluster around a straight line, then the correlation coefficient is close to zero even if the variables have a strong nonlinear association. The correlation coefficient does not reflect nonlinear relationships between variables, only. The correlation coefficient measures only linear association: how nearly the data fall on a straight line. it is not a good summary of association if the scatterplot has a nonlinear (curved) pattern. Homoscedastic if the sd of the values of y for points in a vertical slice through the scatterplot is.