STAT 2510 Lecture Notes - Lecture 2: Zip Code, Pie Chart, Tally Marks

18 Jan 2017
School
Department
Course
Professor
Document Summary
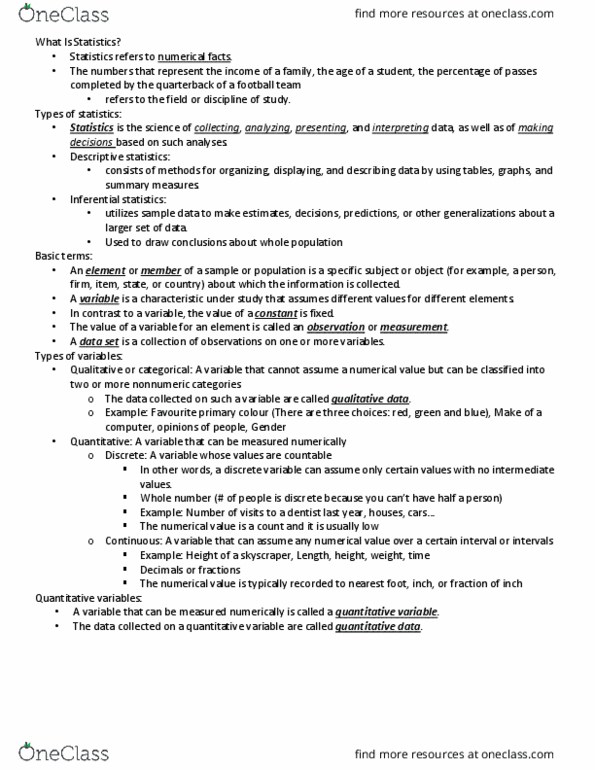
Variables characteristic that varies from one person or thing to another. Examples eye color, gender, blood type, and zip code. Two types of quantitative: discrete possible values can be listed; only finite # of possibilities, counts, ex. Number of siblings: continuous possible values from some interval of numbers, measurement, ex. Data values of a variable (not always numeric value) Different types of data qualitative, quantitative, discrete, and continious. Observation one single measurement or individual piece of data (one value) Data set collection of values for all variables of interest. Frequency distribution of qualitative data listing of distinct values and their frequencies. Constructing frequency distribution: list distinct values, place tally mark in second row for distinct value, count tally marks in each row. Relative frequency is better than frequency for comparing 2 data sets. Pie chart disk divided into wedges proportional to the relative frequency. Relative frequency multiplied by 360 gives degree measure of angle.