POLS 1000 Lecture Notes - Lecture 9: Feasible Region, Minimax, Shadow Price

4 Dec 2017
School
Department
Course
Professor
Document Summary
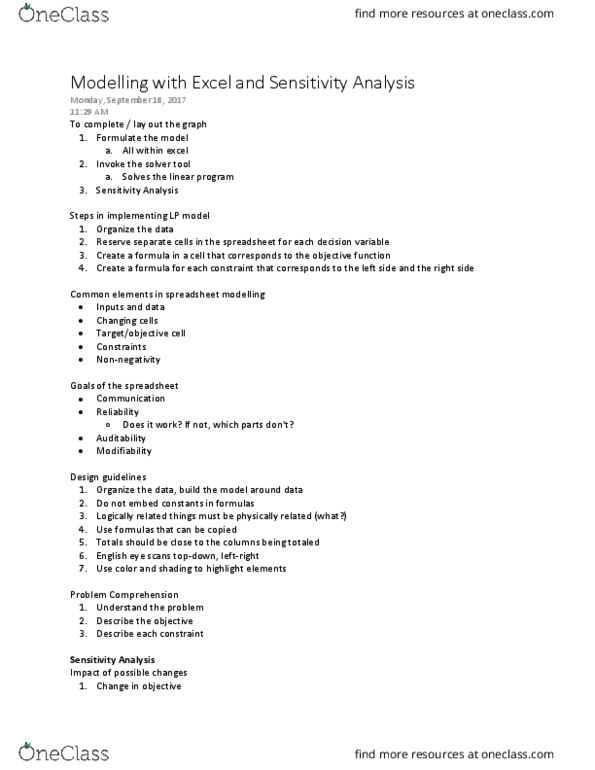
Solving lps graphically only possible with 2 decision variables rare in real world so we. Common elements in all lp spreadsheet models. Numerical data needed to form objectives and constraints. Changing cells: cells used instead of x s or y s to represent values in objective function, values in cell can be changed to optimize objective function. Target (objective) cell: one cell that contains the value of the objective. Constraints and nonnegativity are not explicitly shown but are implemented. To create excel lp spreadsheet for 2 variables, have 4 columns. First column: constraints + production (example) constraint names listed under. Second column: variable 1 and production values for variable 1 listed under. Third column: variable 2 and production values for variable 2 listed under. Fourth column: value of constraint limits on each type of production . Excel solver method: click data analysis click solver fill in set objective box with target cell beside max/min objective function on your spreadsheet.