MGMT 1050 Lecture Notes - Lecture 2: Frequency Distribution, Bar Chart, Level Of Measurement

Document Summary
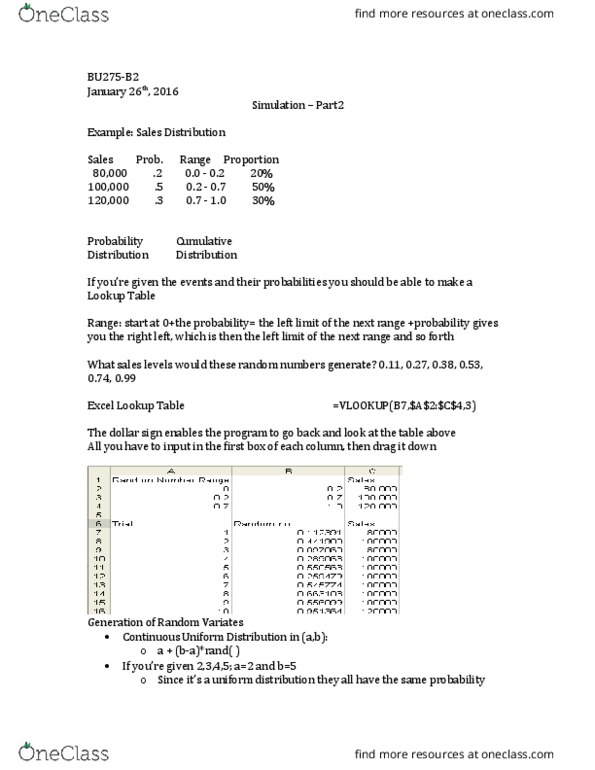
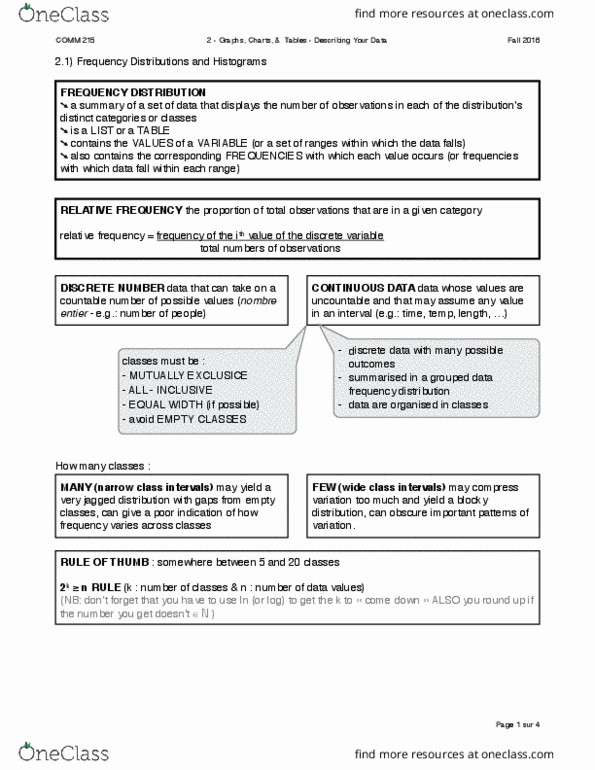
Generate 200 random numbers uniformly distributed between 0 and 200: rand () -> uniform between 0 and 1, 120* rand () -> uniform between 0 and 120. A spreadsheet with many data points doesn"t help decision makers. We need to organize the fata to make it useful. Range = largest value smallest value: = maximum minimum. Range = max () min () In the example: maximum = 119. 23, minimum = 0. 43, range = 119. 23 0. 43 = 118. 80. Each interval of category is referred to as a class. Number of data point within a certain interval (or category) Sturges" rule: number of classes = 1+ 3. 3 [log10(n)] Alternatively: number of classes = 1 + [ln(n)]/[ln(2)] This rule is a guideline, but it is sometimes necessary to use different classes (e. g. , standard classes, schulich grading scheme) Number of classes = 1+ln (200)/ln (2) = 8. 64, 9.