MGMT 1050 Lecture Notes - Lecture 8: Probability Distribution, Standard Normal Deviate, Random Variable

14 Mar 2018
School
Department
Course
Professor
Document Summary
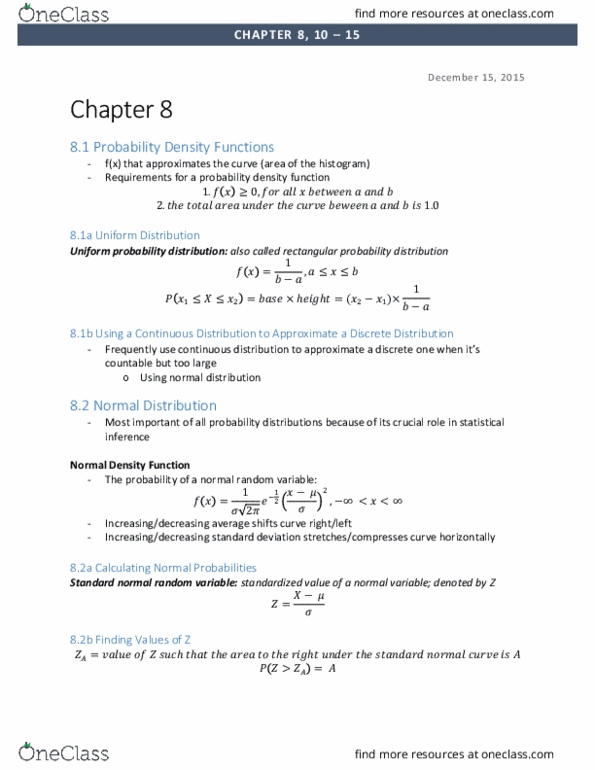
Infinite number of values, and thus cannot be listed. Probability of a specific value is virtually 0. Consequently, we can determine the probability of only a range of values. Histogram with the relative frequencies divided by the interval width depicts rectangles whose area equals the probability that the random variable will fall into that interval. If the histogram is drawn with a large number of small intervals, we can smooth the edges of the rectangles to produce a smooth curve. This function is called a probability density function. The following requirements apply to a probability density function f(x) whose range is a. The total area under the curve between a and b is 1. 0 f(x) 0 for all x between a and b. F(x) = 1/(b a) where a x b. Probability of any range is the product of the difference of that range and height, 1/(b a)