MATH 1300 Lecture Notes - Lecture 2: Scatter Plot, Even And Odd Functions, Negative Number

1 Feb 2018
School
Department
Course
Professor


28
MATH 1300 Full Course Notes
Verified Note
28 documents
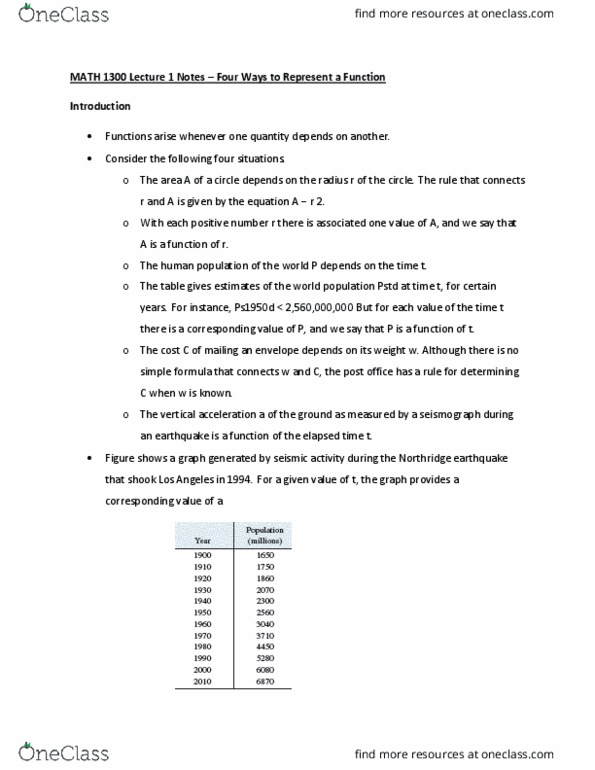
Document Summary
Math 1300 lecture 2 notes representations of functions. Representations of functions: there are four possible ways to represent a function, verbally (by a description in words, numerically (by a table of values, visually (by a graph, algebraically (by an explicit formula) 0j s0, d: we are given a description of the function in words: pstd is the human population of the world at time t. Let"s measure t so that t 0 corresponds to the year 1900: the table of values of world population provides a convenient representation of this function. If we plot these values, we get the graph (called a scatter plot) in figure. Of course, it"s impossible to devise an explicit formula that gives the exact human population pstd at any time t: but it is possible to find an expression for a function that approximates pstd.