FINE 2000 Lecture Notes - Arthur Andersen, Historical Cost, Minority Interest

Get access


Related Documents
Related Questions
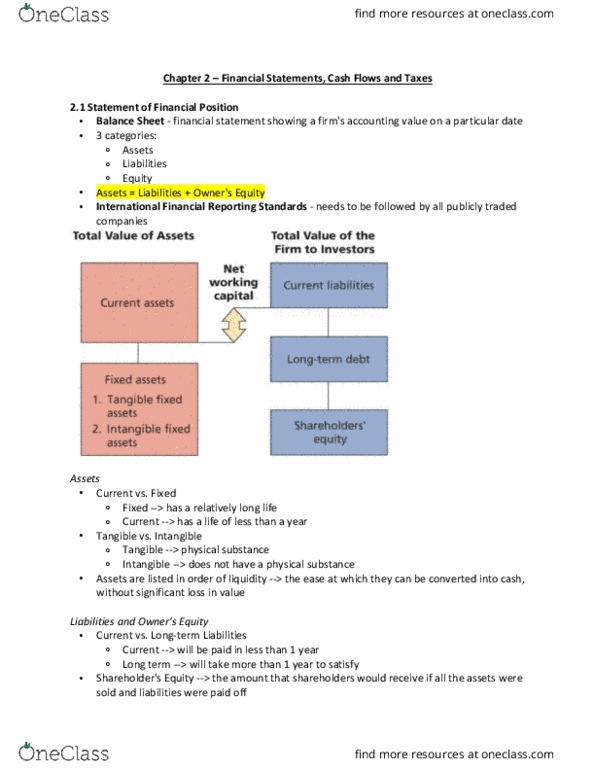
2. Balance sheet
The balance sheet provides a snapshot of the financial conditionof a company. Investors and analysts use the information given onthe balance sheet and other financial statements to make severalinterpretations regarding the companyâs financial condition andperformance.
Blue Hamster Manufacturing Inc. is a hypothetical company.Suppose it has the following balance sheet items reported at theend of its first year of operation. For the second year, some partsare still incomplete. Use the information given to complete thebalance sheets for Blue Hamster Manufacturing Inc. for the yearsending December 31, Year 2 and 1, respectively.
Blue Hamster Manufacturing Inc. | |||||
|---|---|---|---|---|---|
Balance Sheet | |||||
For the Year ended December 31 | |||||
| Year 2 | Year 1 | Year 2 | Year 1 | ||
| Assets | Liabilities and equity | ||||
| Current assets: | Current liabilities: | ||||
| Cash and equivalents | $55,350 | Accounts payable | $0 | $0 | |
| Accounts receivable | $25,312 | $20,250 | Accruals | $3,516 | $0 |
| Inventories | $74,250 | $59,400 | Notes payable | $19,921 | $18,750 |
| Total current assets | $168,750 | $135,000 | Total current liabilities | $18,750 | |
| Net fixed assets: | Long-term debt | $70,312 | $56,250 | ||
| Net plant and equipment | $165,000 | Total debt | $93,750 | $75,000 | |
| Common equity: | |||||
| Common stock | $182,812 | $146,250 | |||
| Retained earnings | $78,750 | ||||
| Total common equity | $281,250 | $225,000 | |||
| Total assets | $375,000 | $300,000 | Total liabilities and equity | $375,000 | $300,000 |
Given the information in the preceding balance sheetâandassuming that Blue Hamster Manufacturing Inc. has 50 million sharesof common stock outstandingâread each of the following statements,then identify the selection that best interprets the informationconveyed by the balance sheet.
Statement #1: Blue Hamsterâs pool of relatively liquid assets,which are available to support the companyâs current and futuresales, decreased from Year 1 to Year 2.
This statement is , because:
Blue Hamsterâs total current liabilities balance decreased by$33,750 between Year 1 and Year 2.
Blue Hamsterâs total current liabilities balance increased from$20,250 to $25,312 between Year 1 and Year 2.
Blue Hamsterâs total current asset balance actually increasedfrom $135,000 to $168,750 between Year 1 and Year 2.
Blue Hamsterâs total current asset balance decreased from$168,750 to $135,000 between Year 1 and Year 2.
Statement #2: In Year 2, Blue Hamster Manufacturing Inc. wasprofitable.
This statement is , because:
Blue Hamsterâs retained earnings account increased between theend of Years 1 and 2.
The cash and equivalents account increased between Years 1 and2.
Blue Hamsterâs total assets increased between Years 1 and 2.
Statement #3: The book value per share of Blue Hamsterâs stockin Year 2 was $5,625.
This statement is , because:
The per-share book value is calculated by dividing the companyâstotal assets by the number of outstanding shares of commonstock.
The per-share book value is calculated by dividing the companyâstotal debt by the number of outstanding shares of common stock.
The per-share book value is calculated by dividing the companyâstotal common equity by the number of outstanding shares of commonstock.
Based on your understanding of the different items reported onthe balance sheet and the information they provide, if everythingelse remains the same, then the cash and equivalents item on thecurrent balance sheet is likely to if the firm issues$3 million of new common stock.
Based on your understanding of the different items reported inthe balance sheet and the information they provide, which statementregarding Blue Hamster Manufacturing Inc.âs balance sheet isconsistent with U.S. Generally Accepted Accounting Principles(GAAP)?
The companyâs assets should be listed in alphabetical order.
The companyâs assets should be listed in the order in which theyare to be converted into cash.
The companyâs assets should be listed from those carrying thelargest balance to those with the smallest balance.


| Joshua & White Technologies: December 31 Balance Sheets | ||||||
| (Thousands of Dollars) | ||||||
| Assets | 2010 | 2009 | ||||
| Cash and cash equivalents | $21,000 | $20,000 | ||||
| Short-term investments | 3,759 | 3,240 | ||||
| Accounts Receivable | 52,500 | 48,000 | ||||
| Inventories | 84,000 | 56,000 | ||||
| Total current assets | $161,259 | $127,240 | ||||
| Net fixed assets | 218,400 | 200,000 | ||||
| Total assets | $379,659 | $327,240 | ||||
| Liabilities and equity | ||||||
| Accounts payable | $33,600 | $32,000 | ||||
| Accruals | 12,600 | 12,000 | ||||
| Notes payable | 19,929 | 6,480 | ||||
| Total current liabilities | $66,129 | $50,480 | ||||
| Long-term debt | 67,662 | 58,320 | ||||
| Total liabilities | $133,791 | $108,800 | ||||
| Common stock | 183,793 | 178,440 | ||||
| Retained Earnings | 62,075 | 40,000 | ||||
| Total common equity | $245,868 | $218,440 | ||||
| Total liabilities and equity | $379,659 | $327,240 | ||||
| Joshua & White Technologies December 31 Income Statements | ||||||
| (Thousands of Dollars) | ||||||
| 2010 | 2009 | |||||
| Sales | $420,000 | $400,000 | ||||
| Expenses excluding depr. and amort. | 327,600 | 320,000 | ||||
| EBITDA | $92,400 | $80,000 | ||||
| Depreciation and Amortization | 19,660 | 18,000 | ||||
| EBIT | $72,740 | $62,000 | ||||
| Interest Expense | 5,740 | 4,460 | ||||
| EBT | $67,000 | $57,540 | ||||
| Taxes (40%) | 26,800 | 23,016 | ||||
| Net Income | $40,200 | $34,524 | ||||
| Common dividends | $18,125 | $17,262 | ||||
| Addition to retained earnings | $22,075 | $17,262 | ||||
| Other Data | 2010 | 2009 | ||||
| Year-end Stock Price | $90.00 | $96.00 | ||||
| # of shares (Thousands) | 4,052 | 4,000 | ||||
| Lease payment (Thousands of Dollars) | $20,000 | $20,000 | ||||
| Sinking fund payment (Thousands of Dollars) | $0 | $0 | ||||
| Ratio Analysis | 2010 | 2009 | Industry Avg | |||
| Liquidity Ratios | ||||||
| Current Ratio | 2.38 | 2.52 | 2.58 | |||
| Quick Ratio | 1.17 | 1.41 | 1.53 | |||
| Asset Management Ratios | ||||||
| Inventory Turnover | 1.11 | 1.22 | 7.69 | |||
| Days Sales Outstanding | 45.63 | 43.80 | 47.45 | |||
| Fixed Assets Turnover | 1.92 | 2.00 | 2.04 | |||
| Total Assets Turnover | 3.81 | 5.64 | 1.23 | |||
| Debt Management Ratios | ||||||
| Debt Ratio | 32.1% | |||||
| Times-interest-earned ratio | 15.33 | |||||
| EBITDA coverage ratio | 4.18 | |||||
| Profitability Ratios | ||||||
| Profit Margin | 9.57% | 8.63% | 8.86% | |||
| Basic Earning Power | 19.16% | 18.95% | 19.48% | |||
| Return on Assets | 10.59% | 10.55% | 10.93% | |||
| Return on Equity | 21.87% | 19.35% | 16.10% | |||
| Market Value Ratios | ||||||
| Earnings per share | NA | |||||
| Price-to-earnings ratio | 10.65 | |||||
| Cash flow per share | NA | |||||
| Price-to-cash flow ratio | 7.11 | |||||
| Book Value per share | NA | |||||
| Market-to-book ratio | 1.72 | |||||
| a. Has Joshua & White's liquidity position improved or worsened? Explain. | ||||||
| The position of JW has worsend because there ration has fallen from 1.41 to 1.17 | ||||||
| b. Has Joshua & White's ability to manage its assets improved or worsened? Explain. | ||||||
| c. How has Joshua & White's profitability changed during the last year? | ||||||
| d. Perform an extended Du Pont analysis for Joshua & White for 2008 and 2009. | ||||||
| ROE = | PM x | TA Turnover x Equity Multiplier | ||||
| 2010 | ||||||
| 2009 | ||||||
| e. Perform a common size analysis. What has happened to the composition | ||||||
| (that is, percentage in each category) of assets and liabilities? | ||||||
| Common Size Balance Sheets | ||||||
| Assets | 2010 | 2009 | ||||
| Cash and cash equivalents | ||||||
| Short-term investments | ||||||
| Accounts Receivable | ||||||
| Inventories | ||||||
| Total current assets | ||||||
| Net fixed assets | ||||||
| Total assets | ||||||
| Liabilities and equity | 2010 | 2009 | ||||
| Accounts payable | ||||||
| Accruals | ||||||
| Notes payable | ||||||
| Total current liabilities | ||||||
| Long-term debt | ||||||
| Total liabilities | ||||||
| Common stock | ||||||
| Retained Earnings | ||||||
| Total common equity | ||||||
| Total liabilities and equity | ||||||
| Common Size Income Statements | 2010 | 2009 | ||||
| Sales | ||||||
| Expenses excluding depr. and amort. | ||||||
| EBITDA | ||||||
| Depreciation and Amortization | ||||||
| EBIT | ||||||
| Interest Expense | ||||||
| EBT | ||||||
| Taxes (40%) | ||||||
| Net Income | ||||||
| f. Perform a percent change analysis. What does this tell you about the change in profitability | ||||||
| and asset utilization? | ||||||
| Percent Change Balance Sheets | Base | |||||
| Assets | 2010 | 2009 | ||||
| Cash and cash equivalents | ||||||
| Short-term investments | ||||||
| Accounts Receivable | ||||||
| Inventories | ||||||
| Total current assets | ||||||
| Net fixed assets | ||||||
| Total assets | ||||||
| Base | ||||||
| Liabilities and equity | 2010 | 2009 | ||||
| Accounts payable | ||||||
| Accruals | ||||||
| Notes payable | ||||||
| Total current liabilities | ||||||
| Long-term debt | ||||||
| Total liabilities | ||||||
| Common stock | ||||||
| Retained Earnings | ||||||
| Total common equity | ||||||
| Total liabilities and equity | ||||||
| Base | ||||||
| Percent Change Income Statements | 2010 | 2009 | ||||
| Sales | ||||||
| Expenses excluding depr. and amort. | ||||||
| EBITDA | ||||||
| Depreciation and Amortization | ||||||
| EBIT | ||||||
| Interest Expense | ||||||
| EBT | ||||||
| Taxes (40%) | ||||||
| Net Income | ||||||
