EC207 Lecture Notes - Lecture 19: Brad Delson, Gini Coefficient, Lorenz Curve

Document Summary
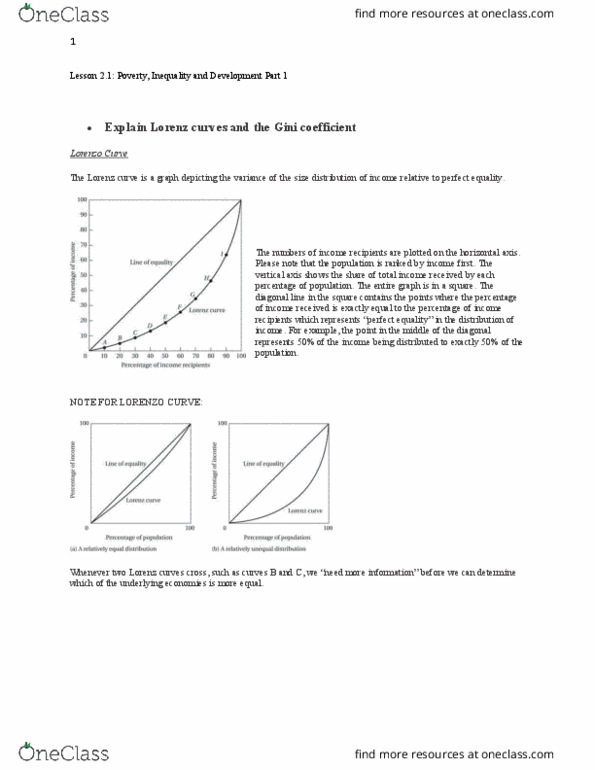
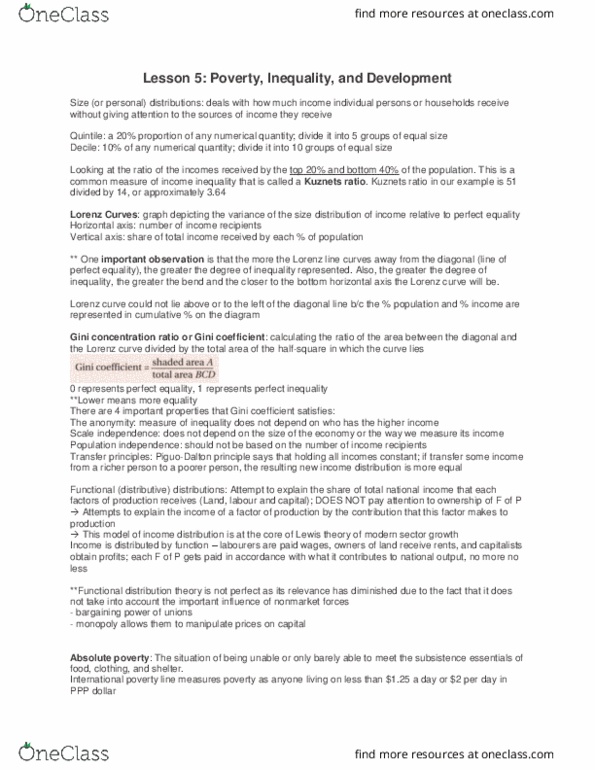
Steps: sort the population in ascending order of income, the numbers of income recipients are plotted on the horizontal axis, not in absolute terms but in cumulative percentages. The vertical axis shows the share total of income received by each percentage in the population. Cumulative up to 100%, meaning both axes are the same length. The entire figure is enclosed in a square, and a diagonal line is drawn from the lower left corner (the origin) of the square to the upper right corner. At every point on that diagonal the percentage of income received is exactly equal to the percentage of the income recipients. The lorenz curve shows the actual quantitative relationship between the percentage of income recipients and the percentage of total income they did in fact receive during a given year. ***the greater the curvature of the lorenz line, the greater the relative degree of inequality***