EC120 Lecture Notes - Lecture 1: Pie Chart, Bar Chart, Demand Curve


30
EC120 Full Course Notes
Verified Note
30 documents
Document Summary
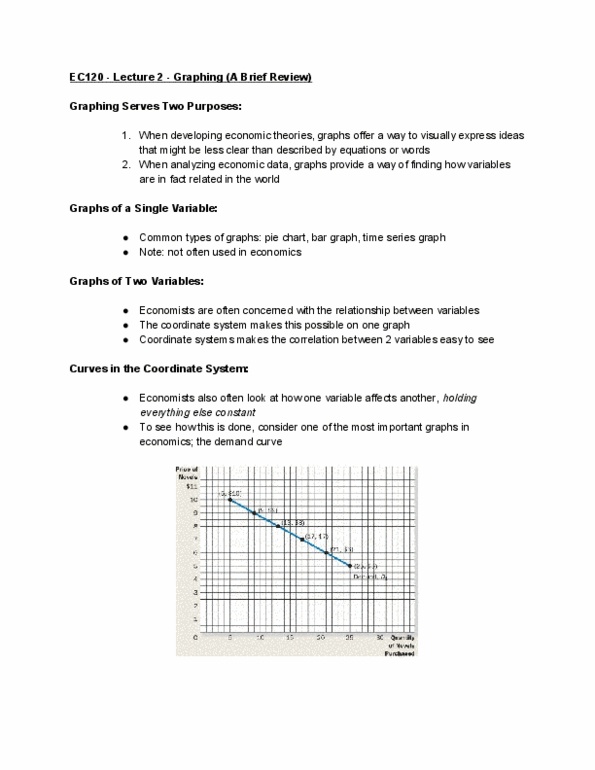
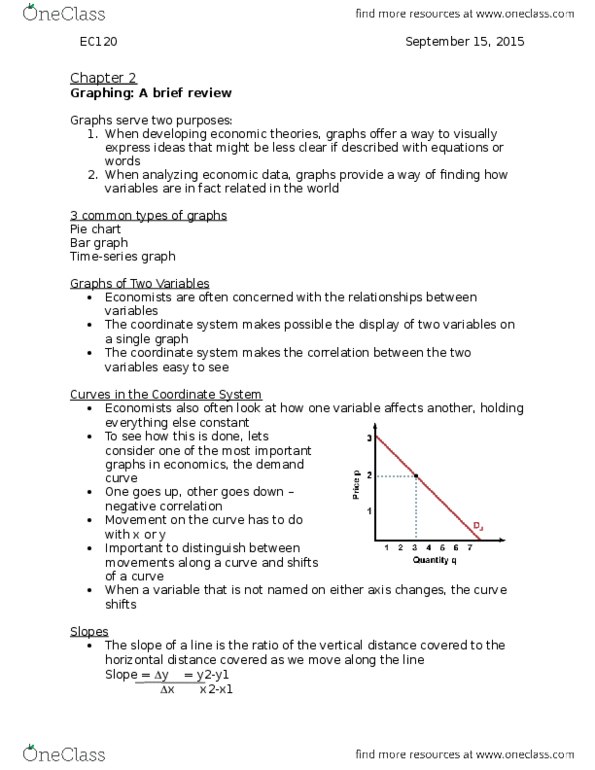
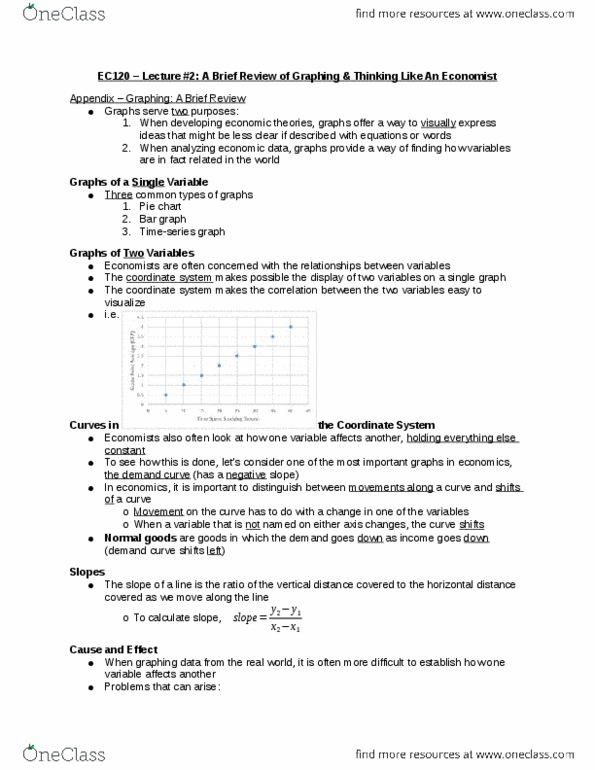
Three common types of graphs: pie chart in panel, bar graph in panel, time-series graph. Economists are often concerned with the relationships between variables. The coordinate system makes possible the display of two variables on a single graph. The coordinate system makes the correlation between the two variables easy to see. Economists also often look at how one variable affects another, holding everything else constant. To see how this is done, let"s consider one of the most important graphs in economics- the demand curve. The demand curve traces the effect of a good"s price on the quantity of the good consumers want to buy. In economics, it is important to distinguish between movements along a curve and shifts of a curve. When a variable that is not named on either axis changes, the curve shifts. The slope of a line is the ratio of the vertical distance covered to the horizontal distance covered as we move along the line.