BU127 Lecture Notes - Lecture 2: Frequency Distribution, Railways Act 1921


6
BU127 Full Course Notes
Verified Note
6 documents
Document Summary
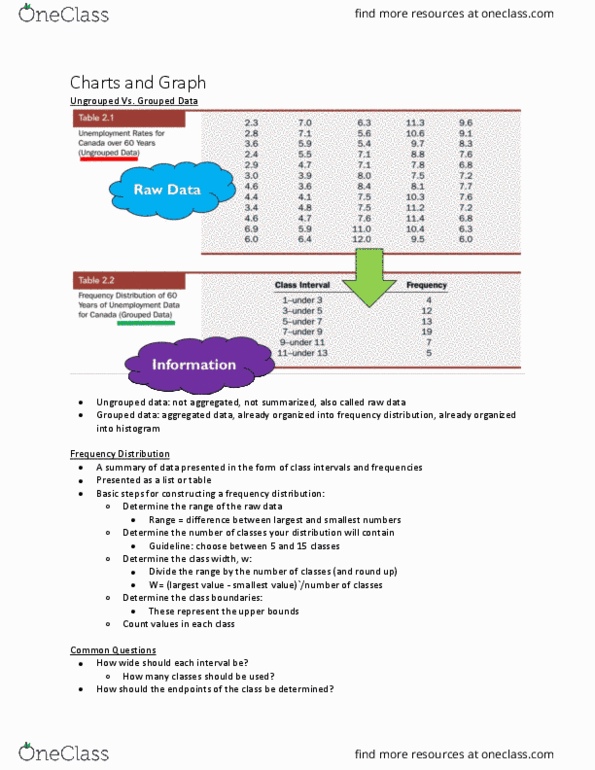
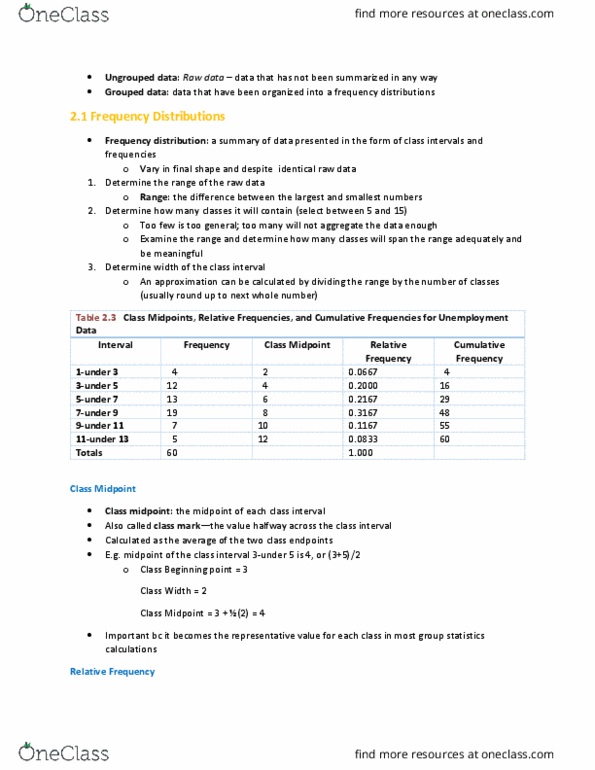
Frequency distribution- summary of data represented in the form of class intervals and frequencies. Table 2. 2 frequency distribution of 60 years of unemployment data for canada (grouped data) 2 steps to constructing raw data: range- difference between the largest and smallest number. 0: class- select between 5 and 15 classes. For the data above it was grouped into 6 classes, which is shown in the first example: grouping data into classes. Sort from low to high (only if you are doing this by hand) Find range: 19 - 2 = 17 lbs. Select number of classes: 10 (usually between 5 and 20) Compute class width: 2 (17/10 then round up) Determine class boundaries: 2, 4, , 20 (these are the. Count the number of values in each class. Relative frequency- is the proportion of the total frequency that is in any given class interval in a frequency distribution. Relative frequency is the individual class frequency divided by the total frequency.