Statistical Sciences 2244A/B Lecture Notes - Lecture 7: Unimodality, Normal Distribution, Histogram

15 Jan 2017
School
Department
Professor
Document Summary
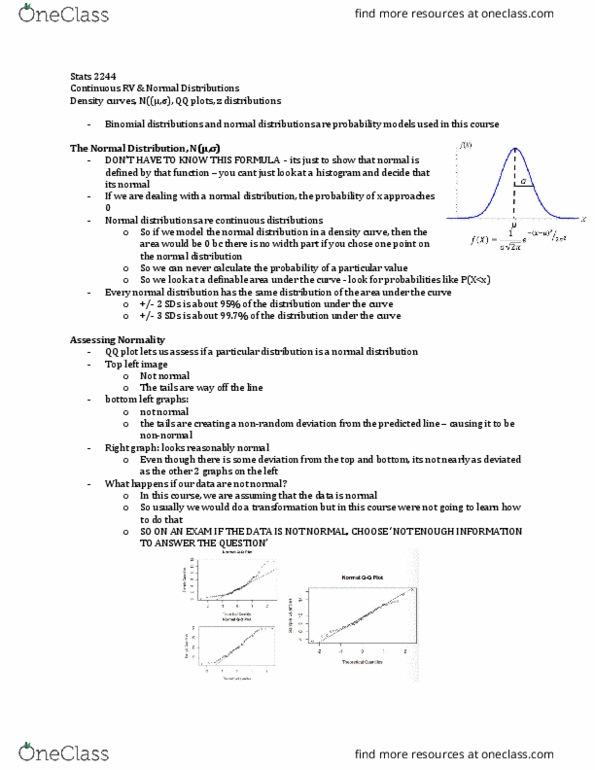
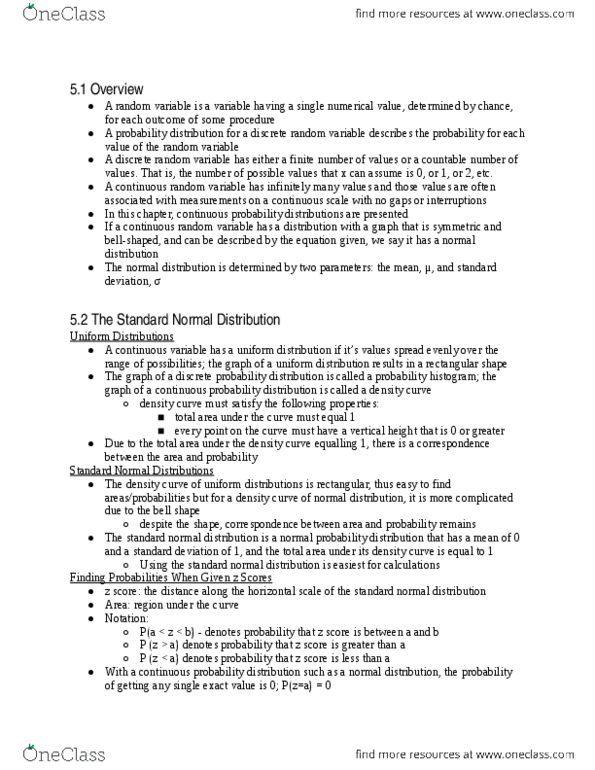
Lecture 007 - continuous random variables and normal distributions. Learning objectives identify situations in which can be described by a normal distribution. Understand characteristics of density curves and normal distributions. Create (with r) and interpret qq plots to assess normality. Calculate a z-score or related values where appropriate. Use the z-distribution table, where applicable, to find z-values or probabilities. However, continuous variables are not described very well in density histogram. The probability of any single value will be zero. No area under the graph since there is no width. But we can find the probability of a range of value. All normal curves are unimodal, symmetric and bell-shaped. But not all unimodal, symmetric and bell-shape curves are normal. Mean, median and mode will all be the same. Distance between the mean and the point of inflection. Do not need to be able to make them. Do not need to be able to tell skewness either.