Statistical Sciences 1024A/B Lecture Notes - Lecture 7: Standard Deviation, Sample Space, Random Variable

19 Oct 2016
School
Department
Professor
Document Summary
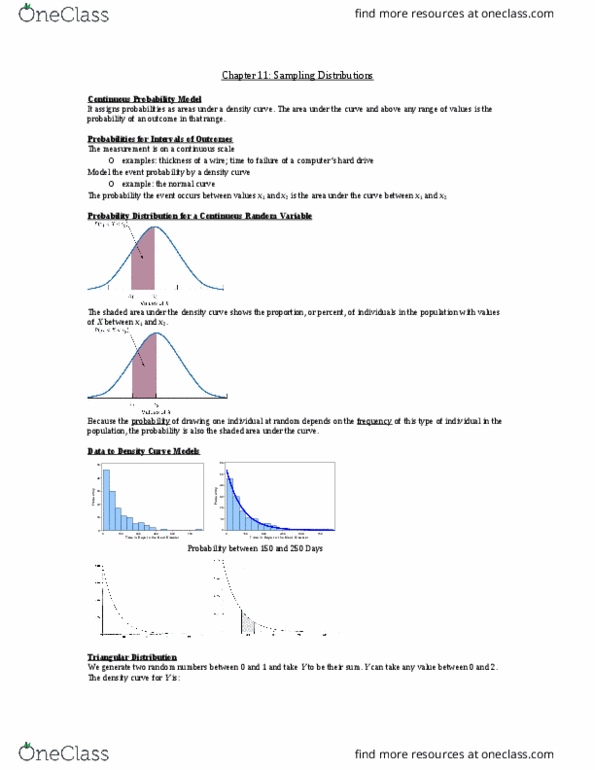
A random variable is variable which takes numerical values corresponding to outcomes of a random phenomenon. Probability distribution is a rule, formula or function that tells us which values a random variable can take on and provides us a method to assign probabilities to the values of the random variable. A continuous probability model describes the pattern of the values a random variable can take on using a density curve. A density curve describes the theoretical pattern or distribution of a random variable and this description is in terms of a mathematical function. A density curve always sits on or above the horizontal axis and has an area of exactly. The area under the curve for a given range of values is the probability that random variable takes on values in that range. We often use density curves to model (or describe) results of random phenomena.