Sociology 2206A/B Lecture : Analyzing Quantitative Data

12 Mar 2012
School
Department
Course
Professor
Document Summary
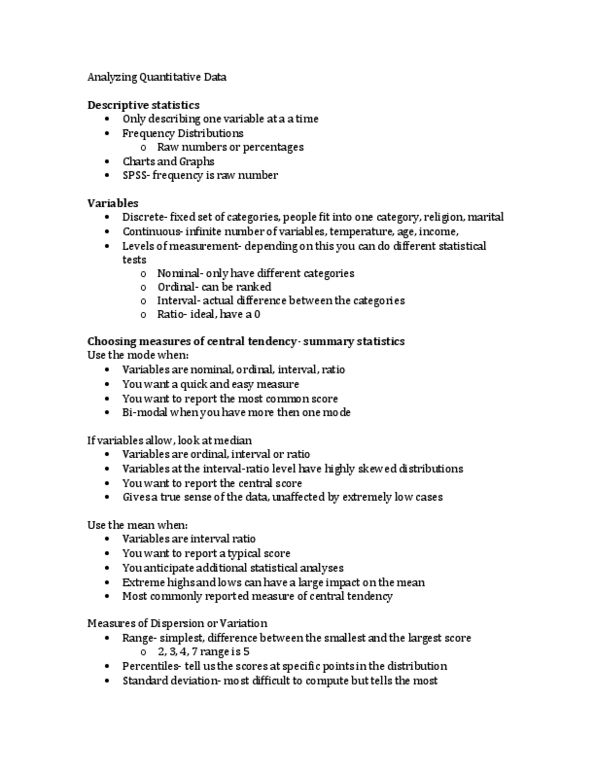
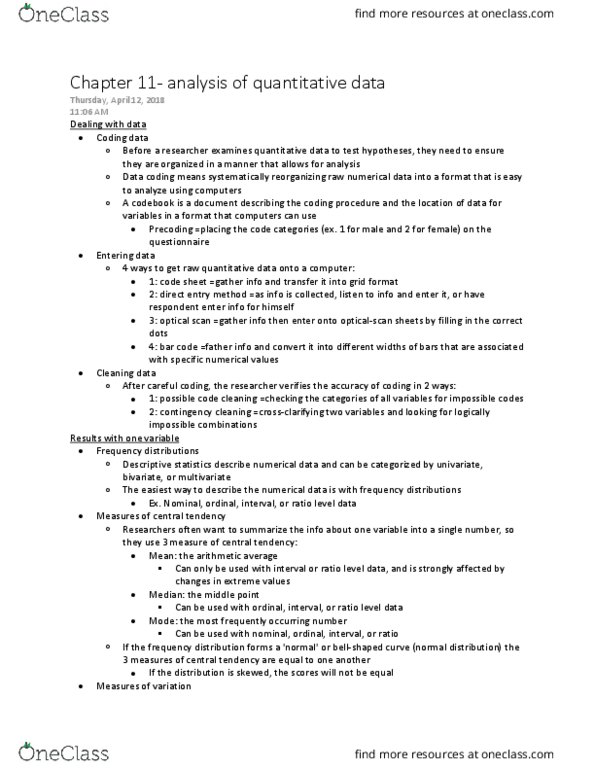
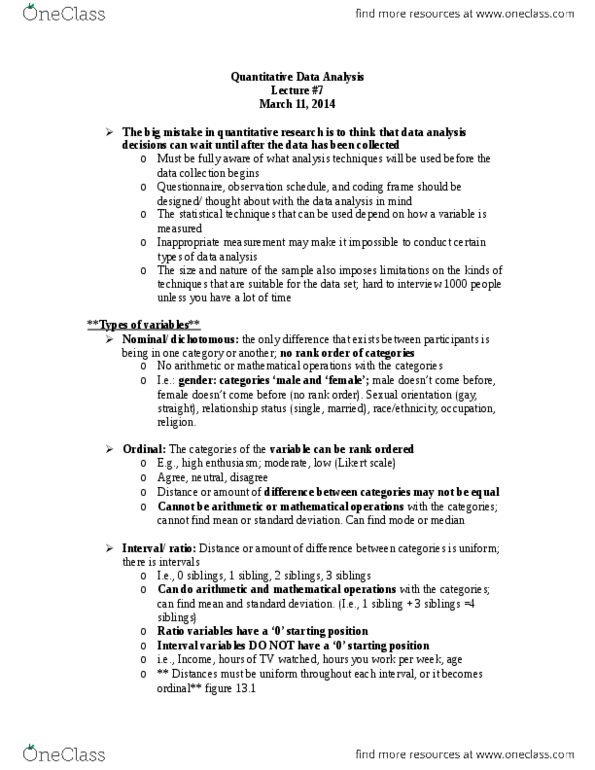
Most common ones look at frequency distributions: see raw numbers or percentages. Also can look at charts and graphs. Discrete fixed set of values or value attributes. Continuous infinite number of values, usually on a continuum. Use the mode when : variables are nominal, ordinal, interval, or ratio, you want a quick and easy measure, you want to report the most common score. Ex: 5 8 9 2 8 3 7 4 7 0 3 8 3 1 5. Bimodal distribution - more than one mode (have 2) Use the median when : variables are ordinal, interval, or ratio, variables at the interval-ratio level have highly skewed distributions, you want to report the central score. Ex: 3 8 14 19 27 28 46. Ex: 15 19 21 30 36 45 48 58. Use the mean when : variables are interval-ratio, you want to report a typical score, you anticipate additional statistical analyses.