Sociology 2205A/B Lecture Notes - Lecture 5: Categories Of New Testament Manuscripts, Interval Ratio, Central Tendency

31 Jan 2016
School
Department
Course
Professor
Document Summary
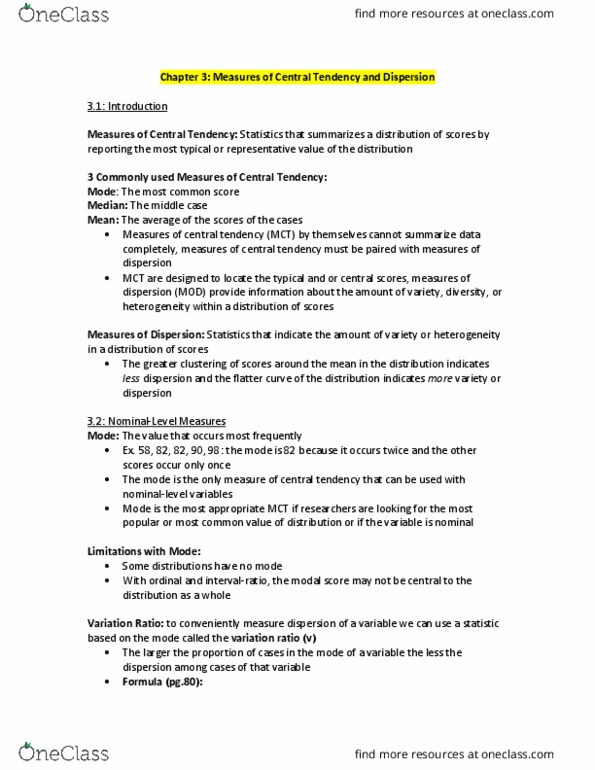
Histograms and frequency polygons are commonly used for interval-ration data. Bar graphs/pie charts most often used for nominal or ordinals. See healey p. 59-65 for details on how to build graphs and charts. Array the real limits of the intervals or scores along the horizontal axis. For each category, construct a bar with height corresponding to number of cases and width corresponding to real limits of intervals. Frequency polygram- uses a dot to represent the frequency of each real or stated interval, a line connects the dots. Lecture 3 measures of central tendency and dispersion. The taller a curve the less dispersion, flatter has more dispersion. Variation reatio is one of only a few measures of dispersion form nominal-level variables. Variation ratio is simply the proportion of cases not in the modal category. V has a lower limit of 0 and increases to 1. The distance from the third quartile to the first.