Sociology 2205A/B Lecture Notes - Lecture 13: Scatter Plot, Interval Ratio

4 Oct 2018
School
Department
Course
Professor
Document Summary
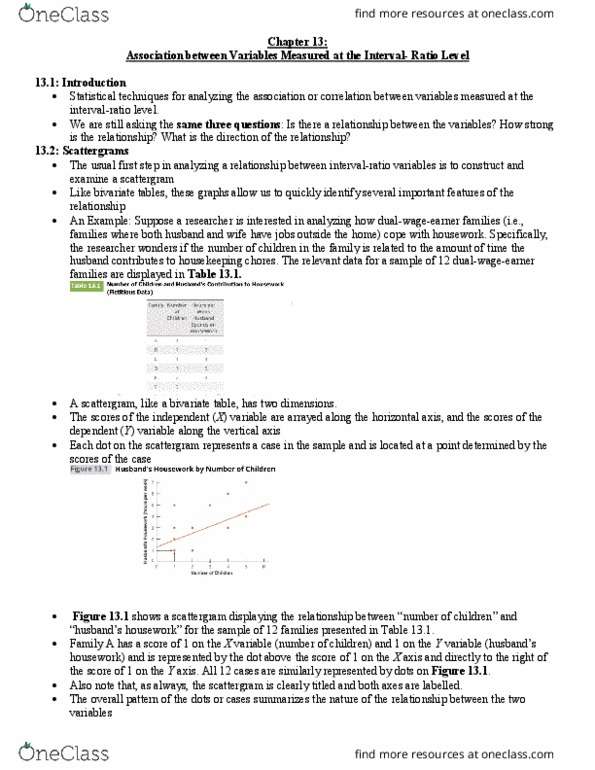
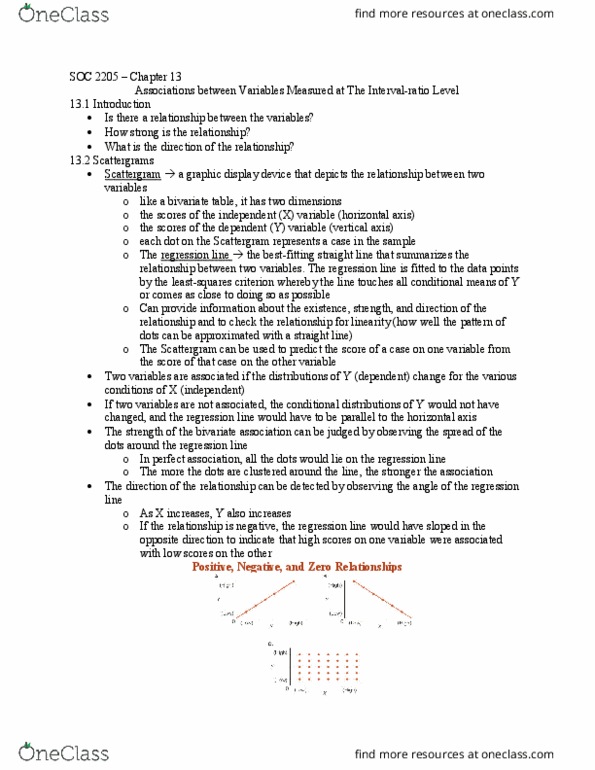
It is the first step in analyzing a relationship between two interval-ratio variables. The x (independent) variable is arrayed along the horizontal axis. The y (dependent) variable is arrayed along the vertical axis. Each dot on a scattergram is a case in the data set. The dot is placed at the intersection of the case"s scores on x and y. The greater the extent to which dots are clustered around the regression line, the stronger the relationship. The least squares regression line is the single straight regression line that best fits the pattern of the data points. Where: y = score on the dependent variable. Where: y = score on the dependent variable a = the y intercept or the point where the regression line crosses the y axis. = the slope of the regression line or the amount of change produced in y by a unit change in x.