Sociology 2205A/B Lecture Notes - Lecture 4: Standard Score, Normal Distribution, Standard Deviation

25 Apr 2018
School
Department
Course
Professor
Document Summary
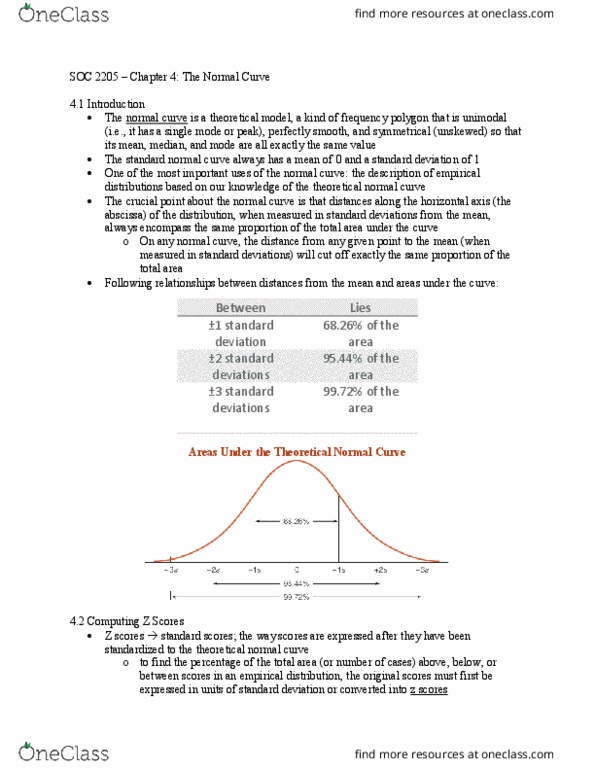
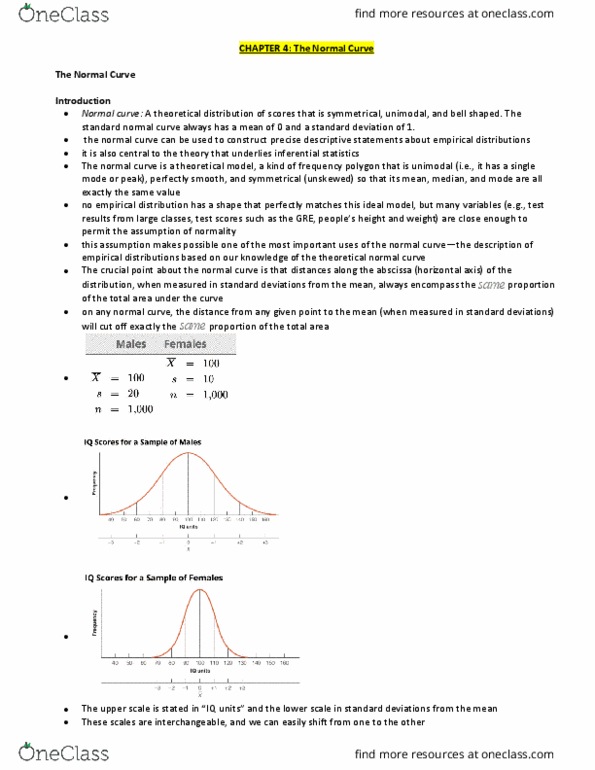
The (cid:862)area u(cid:374)der the cur(cid:448)e(cid:863) is (cid:373)easured i(cid:374) sta(cid:374)dard de(cid:448)iatio(cid:374)s fro(cid:373) the (cid:373)ea(cid:374) Has a mean = 0 and standard deviation = 1. General relationships: 1 s = about 68. 26% The area under normal curve 2 s = about 95. 44% Z-scores are a way of determining the position of a single score under the normal curve. (how far/near/old/young/high/low) They enable comparison between variables measured in/on different scales. They are measured in standard deviations relative to the mean of the curve. The z-score can be used to determine an area under the curve known as a probability. Has a mean of zero (0) and s. d. of one (1) Formula: z = (xi ) / s. Procedure: to find areas, first compute z scores, substitute score of interest for xi, use sample mean for and sample standard deviation for s, the for(cid:373)ula cha(cid:374)ges a (cid:862)ra(cid:449)(cid:863) score (xi) to a standardized score (z). Appendix a to find areas below a score.