Nursing 3340A/B Lecture Notes - Lecture 8: Frequency Distribution, Standard Score, Statistical Inference

8 Dec 2016
School
Department
Course
Professor
Document Summary
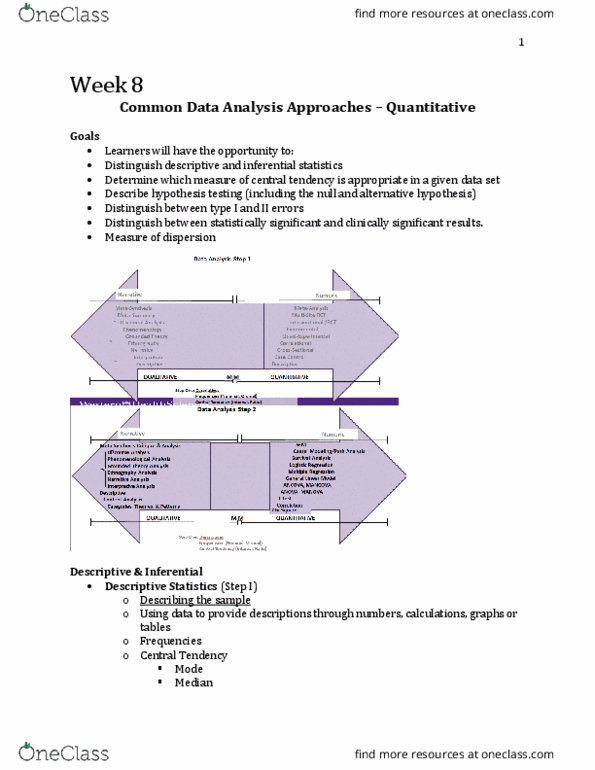
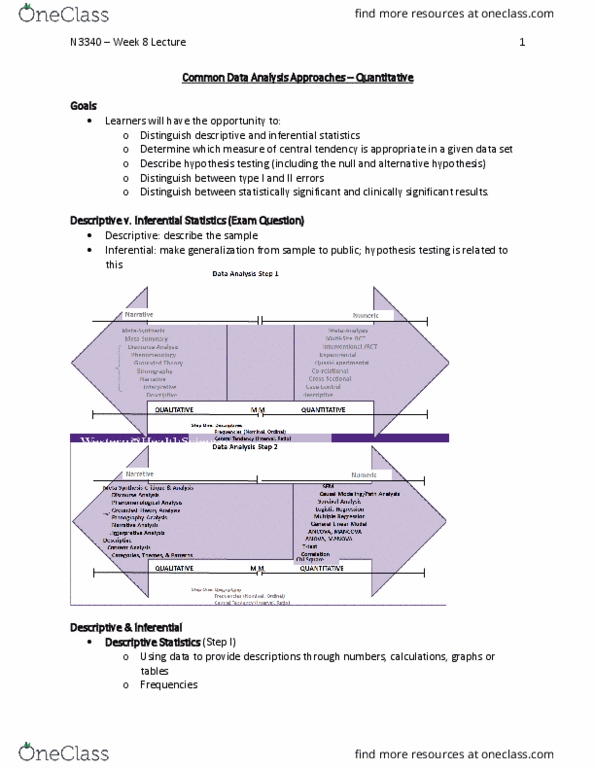
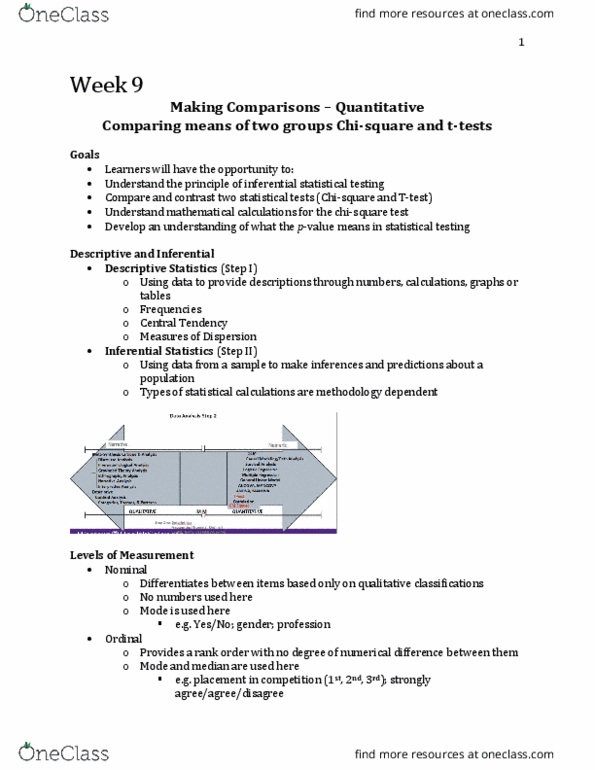
Descriptive statistics (aka step i analysis: using data to provide descriptions through numbers, calculations, graphs or tables, frequencies, central tendency. Inferential statistics (aka step ii analysis: using data from a sample to make inferences and predictions about a population, types of statistical calculations are methodology dependent. Variables can vary from their centre or central tendency. Variation can be explained by two terms: range highest minus lowest, standard deviation. Standard deviation is a measure of how far the data spread from the. The variance formula includes the sigma notation, which represents the sum of all the items to the right of sigma. Mea(cid:374) is represe(cid:374)ted (cid:271)(cid:455) the (cid:862)u(cid:863) a(cid:374)d the (cid:374) is the (cid:374)u(cid:373)(cid:271)er of ite(cid:373)s. Standard deviation shows the variation in data. When the data are close together, the standard deviation will be small. When the data are spread out, the standard deviation will be large. The average distance of the values from the varia(cid:271)le"s (cid:373)ea(cid:374)